Chapter 8. Fluid Responsiveness and Fluid Tolerance
Автор: Vladyslav Dieiev, MD
Співавтори матеріалів: поки немає. Тут може бути ваше ім'я: як долучитися
Переклад готується
Цю сторінку ще не перекладено українською. Нижче наведено англійський текст.
The guidelines behind this chapter
The chapter runs as one argument, and its sources change as the argument moves. Sections 8.1 to 8.5 ask whether stroke volume will rise if fluid is given. Their physiology and dynamic tests come from critical care, principally the Monnet reviews of dynamic testing,1,2 the landmark validations of passive leg raising (PLR), aortic velocity variation, inferior vena cava (IVC) distensibility, superior vena cava (SVC) collapsibility and the mini-fluid challenge,3,4,5,6,7,8 and the reappraisal of the caval indices;9,10,11 the IVC rules for right atrial pressure (RAP) come from the 2015 American Society of Echocardiography (ASE) chamber quantification update12 and its 2025 successor in the ASE right heart guideline.13 Section 8.5 then reads the one ASE guideline that treats fluid responsiveness as an echocardiographic task, the 2015 guideline on echocardiography as a monitor for therapeutic intervention, which defines monitoring, names the parameters to follow in hypotension, sepsis and respiratory failure, gives the PLR threshold for left ventricular outflow tract (LVOT) velocity-time integral (VTI), and states how large a change must be before it means anything.14 The tolerance half (sections 8.6 to 8.11) rests on the physiology of venous hypertension transmitted into the abdominal organs, as set out in a 2026 viewpoint on congestion phenotypes,15 and on the studies that measured the portal, hepatic and intrarenal signals, the case series that applied them, their prospective evaluations and the published technique reviews.16,17,18,19 Section 8.6 asks whether the patient can take the volume, on the congestion literature that separates tolerance from responsiveness.16,17
Sections 8.7 to 8.11 ask what the venous pressure is already costing the organs, through the portal and intrarenal beds, the injury evidence and the way the windows have been combined in the research literature; where a claim rests on work those papers cite from elsewhere, the text names the paper that reported it. Two ASE documents mark the boundary of that territory and govern its reporting (section 8.11): the 2024 cardiac point-of-care ultrasound (POCUS) nomenclature recommendations record that "other protocols focus on splanchnic venous congestion and the abdominal aorta" and that "the Writing Group considers these exams to be outside the scope of cardiac POCUS", while requiring that such a study be named "a cardiac POCUS exam with an exam of the other system" and archived so that "noncardiac elements should be clearly identified";20 and the 2025 reporting standard requires that estimated RAP "should always be reported, even if the observation is 'unable to assess'" and that "abnormal hepatic vein Doppler waveform observations should be reported when warranted (for example, pericardial pathology, volume status, TV pathology)".21 Section 8.12 asks whether guiding fluid either way changes an outcome, on the guidelines and the trials of a dynamic strategy.22,23,24
One piece of the argument is taught elsewhere because it is first of all a pressure estimate: the hepatic vein trace is read in section 6.4, beside the caval algorithm, and its signs are collected in Table 6.3. The IVC appears here in three roles and in Chapter 6 in a fourth. Section 8.4 reads it as an index of preload responsiveness, section 8.6 as a weak sign of intolerance and section 8.10 as the entry criterion of the research score, each at its own caliper site and in its own respiratory phase; the conversion of caval caliber and collapse into a reported RAP belongs to section 6.4. Abbreviations follow the ASE nomenclature set out in Chapter 1 and listed at the back of the book.
Learning objectives
-
Explain why a single preload measurement cannot predict the response to fluid, and state the three conditions that must coexist before a bolus is given.
-
Explain how mean systemic filling pressure, capacitance and right atrial pressure set venous return, and why a central venous pressure is a poor surrogate for volume and a real determinant of organ outflow pressure.
-
Acquire an LVOT Doppler signal precise enough to detect a 10% change in stroke distance, and state its least significant change.
-
Perform passive leg raising by its five rules, choose the combined occlusion test or the mini-fluid challenge when PLR cannot be done, and name the conditions in which the IVC index fails.
-
Recognize pulsatility in the portal and intrarenal veins, name each bed's false positive and false negative, decide whether a congestion finding is a stop point, a decongestion target or nothing, and report the study under the ASE naming rule.
-
Measure IVC distensibility, SVC collapsibility and respiratory variation of LVOT peak velocity, and list the conditions each requires.
-
Separate the tolerance question from the responsiveness question, and name where each of its bedside signals is developed: Chapter 15 for the lung, sections 8.7 to 8.10 for the abdominal veins, section 6.4 for the hepatic vein trace.
-
State what congestion does to the kidney, liver, gut and brain, and what class of evidence supports each claim.
-
Decide and document a fluid decision that separates responsiveness from tolerance.
8.1 Preload responsiveness: the physiology and the question
T1 Fluid raises cardiac output in only half of untested patients and no static index predicts who, so change preload on purpose and watch stroke volume.
Volume expansion is the first-line treatment of acute circulatory failure. When no attempt is made to predict the response, a bolus raises cardiac output in only half of patients.1,2 The reason is the Frank-Starling relationship. A ventricle on the steep part of its curve gains substantial stroke volume from a given preload increment; a ventricle on the flat part gains none, and the slope depends on systolic function, which differs between patients and within one patient over hours. A static measurement therefore cannot answer the question, because one value of central venous pressure (CVP) is compatible with both responsiveness and unresponsiveness, even at low values, and the same objection applies to pulmonary artery occlusion pressure, global end-diastolic volume, aortic flow time and the echocardiographic left ventricular end-diastolic dimension. The numbers behind that objection are old and have not been improved on. In 150 volume challenges in 96 septic patients monitored with a pulmonary artery catheter, in which 65 challenges raised the cardiac index by 15% or more, the pre-infusion CVP was 8 ± 4 mm Hg in responders against 9 ± 4 in non-responders, and the areas under the receiver operating characteristic curves were 0.63 for CVP and 0.58 for pulmonary artery occlusion pressure; a CVP below 8 mm Hg, the figure guidelines of the day named as a resuscitation target, carried a positive predictive value for responsiveness of 47%, and an occlusion pressure below 12 mm Hg one of 54%. Knowing in addition that the stroke volume index was low raised those to 61% and 69%, and combining the two pressures improved nothing.25 Those figures are little better than the 50% a coin would give. Practice has not caught up with this, and in the FENICE inception cohort static markers were still being used to test preload responsiveness in one-third of instances.1
Dynamic testing changes preload on purpose, over seconds to a minute, and watches stroke volume. The preload change is borrowed from the ventilator (pulse pressure and stroke volume variation, caval diameter variation, end-expiratory occlusion), created by posture (PLR, Trendelenburg), or created by a small volume of fluid (mini-fluid challenge). The mini-fluid challenge is the only one of these that, like a conventional fluid challenge, commits the patient to volume that cannot be withdrawn, and the reviewers name that as its major drawback.1,2
The other half of that physiology is the reservoir the preload is drawn from. The veins hold roughly 70% of total blood volume and are about 30 times more compliant than arteries, so large changes in venous volume produce small changes in venous pressure.26 About 70% of blood volume sits as unstressed volume, which fills the veins without distending them, exerts no influence on venous return, and is a reserve recruitable by alpha-adrenergic venoconstriction.27 Volume beyond it stretches the wall and generates a pressure by elastic recoil, the mean systemic filling pressure (Pmsf), which drives blood back toward the right ventricle against the resistance of the venous system and against RAP. Normal human Pmsf is 2–10 mm Hg, and 15–33 mm Hg has been reported in cardiac surgery and septic shock.27 A compartment built that way explains why the static index fails. A pressure measured in it barely moves until the compliant reserve is spent, so one value of CVP belongs equally to a patient with capacitance to spare and to one who has none, and the number cannot separate them.
The same pressure that opposes venous return is what every organ these veins drain must empty against, and that is the second half of this chapter. True perfusion pressure is precapillary arteriolar minus postcapillary venular pressure, and the usual bedside expression, mean arterial pressure minus CVP, stands in for it poorly. The arterial term in the usual expression is generally above 90 mm Hg while the inflow term in the true one may be 35–40 mm Hg, so the real gradient is far narrower, and a rise in venous pressure narrows it by more than an equal fall in arterial pressure does. The point was first made, as Rola and colleagues report, by Winton in 1931, who found that raising venous pressure affected urine output more than an equal reduction in arterial pressure did.17 A bolus that succeeds on the Frank-Starling curve can therefore fail at the capillary, which is why this chapter asks a second question of every patient in whom it asks the first.
Three points frame every decision that follows. Testing is pointless where responsiveness is certain and delay is harmful, namely hemorrhage, overt hypovolemia and the initial phase of septic shock before any volume expansion. It makes sense only in acute circulatory failure, since the question arises only if cardiac output needs to rise, and preload responsiveness by itself is a normal physiological state that does not need correcting.1,2 A positive test then permits fluid without requiring it, because fluid should be given only when hemodynamic instability or signs of shock, preload responsiveness, and limited risk of fluid overload are present at once.28 The European Society of Intensive Care Medicine consensus agrees that preload responsiveness does not imply fluids can be given safely or should be given at all, and that filling pressures and extravascular lung water inform the risk side of the judgment.24 A negative test has the more useful job, which is to stop or withhold fluid and turn to vasopressors, inotropes or a ventilator change instead.1,28
What a central venous pressure can and cannot report
RAP is set by the interaction of cardiac function with return function, so it reports the operating point of the two, which is a different quantity from a filling state, and because the gradient between reservoir and heart is small, technical error in measuring it is proportionally large.29 The pressure relevant to preload is transmural, and a CVP should be read only alongside a measure of cardiac output, because the cardiac function curve has a plateau beyond which volume will not raise output.30 In the ICU the measurement is invasive and error-prone even among experienced operators, and it remains unclear what level is deleterious.16 The flow signal can move before any pressure estimate does, since 1 L of hydroxyethyl starch raised the intrarenal venous impedance index from 0.4 ± 0.3 to 0.7 ± 0.2 in heart failure patients but not in healthy subjects, while estimated filling pressures did not change significantly.31 That asymmetry is the argument for reading the venous waveform as well as the venous pressure, and it is why the congestion sections of this chapter work from Doppler traces.
8.2 The echo signal: LVOT stroke distance and its precision
T1T2 Track LVOT stroke distance, not stroke volume, with the probe held in place, and count a change only once it exceeds the least significant change.
Every echocardiographic test here comes down to repeating one measurement, the LVOT VTI or stroke distance. Stroke volume is cross-sectional area times VTI, but the LVOT diameter is squared in the area term and adds a second, potentially larger error, so the ASE recommends tracking stroke distance alone for serial measurement, assuming a constant diameter; the normal monitoring reference is a VTI greater than 18 cm, and for the right side the right ventricular outflow tract VTI is preferred over a diameter-derived stroke volume.14 Acquisition is covered in Chapter 7. What decides whether a fluid test is interpretable is a 5 to 7 mm pulsed-wave gate placed so the aortic closing click is seen, low wall filters, gain reduced until the dense modal envelope appears, the outer edge of that envelope traced, and two to three cycles averaged in sinus rhythm or five to seven in atrial fibrillation, taken at the same point in the respiratory cycle before and after the intervention.32
Precision decides which tests echocardiography can support at all. In 100 hemodynamically stable patients, averaging three measurements within one examination gave acceptable precision for VTI in sinus rhythm and five were needed in atrial fibrillation; between two successive examinations by the same operator the least significant change (LSC) of VTI was 11% (interquartile range 5–18%), rising to 14% (8–26%) with two operators.33 Reviews cite the LSC of LVOT VTI as 10 to 12% and draw the obvious conclusion that a test whose threshold is 4 to 6% cannot be assessed by TTE unless the threshold is inflated or the test modified.1,2 Against invasive reference in ventilated ICU patients, echocardiographic cardiac output had a precision of 9% versus 8% for thermodilution and a percentage error of 25%, and a change of more than 8% detected a true change of more than 10% with 88% sensitivity and 66% specificity.34 The ASE's own interobserver figure for LVOT VTI is 6% and it calls a change greater than 6% meaningful;14 where the two disagree, use the stricter ICU number when a single measurement pair drives a decision. The corollary is a rule of technique, which is to keep the probe on the chest and the sample volume in one position throughout the maneuver, since most measured variability comes from re-acquiring the window.2,33
8.3 Provocative tests you can do with a probe
T1T2 Passive leg raising by five rules is the first test, with the combined occlusion test or a mini-fluid challenge when it cannot be done.
Passive leg raising: five rules, not a drop of fluid
PLR transfers roughly 300 mL of blood from the legs and splanchnic bed toward the right heart, a reversible preload challenge that costs nothing, can be repeated, and stays reliable during spontaneous breathing, arrhythmia, low tidal volume and low lung compliance.1,2,28 That reliability is entirely conditional on technique, codified as five rules:28
-
Start from the semi-recumbent position. Lowering the trunk while raising the legs recruits the splanchnic reservoir and raises sensitivity, which a supine start forgoes; a study ignoring this reported misleadingly poor performance.
-
T2 Assess the effect by direct measurement of cardiac output. Blood pressure alone is insufficient, because pulse pressure tracks stroke volume imperfectly; it also depends on arterial compliance and pulse wave amplification, both of which can change during the maneuver.
-
Use a technique that captures short-lived change. The effect peaks within one minute then wanes in some patients, so real-time methods (echocardiography, pulse contour analysis, esophageal Doppler) are required, and intermittent thermodilution cannot follow it.1
-
Measure again after returning the patient to semi-recumbent and confirm cardiac output returns to baseline, because in unstable patients a rise during PLR may be spontaneous variation of the disease.
-
Prevent adrenergic stimulation. Tilt the bed to raise the legs, without lifting them by hand, suction secretions first, explain the maneuver to an awake patient, and suspect artifact if heart rate rises significantly, which should not normally happen.
Two mechanical details support rule 5 (Figure 8.1). The bed is tilted so the trunk is horizontal and the legs are at 30 to 45 degrees with the trunk-to-leg angle unchanged, because flexing the hip compresses the femoral vein and reduces the volume mobilized, and cardiac output is read about one minute after the position change, when the effect is maximal (Figure 8.1).32
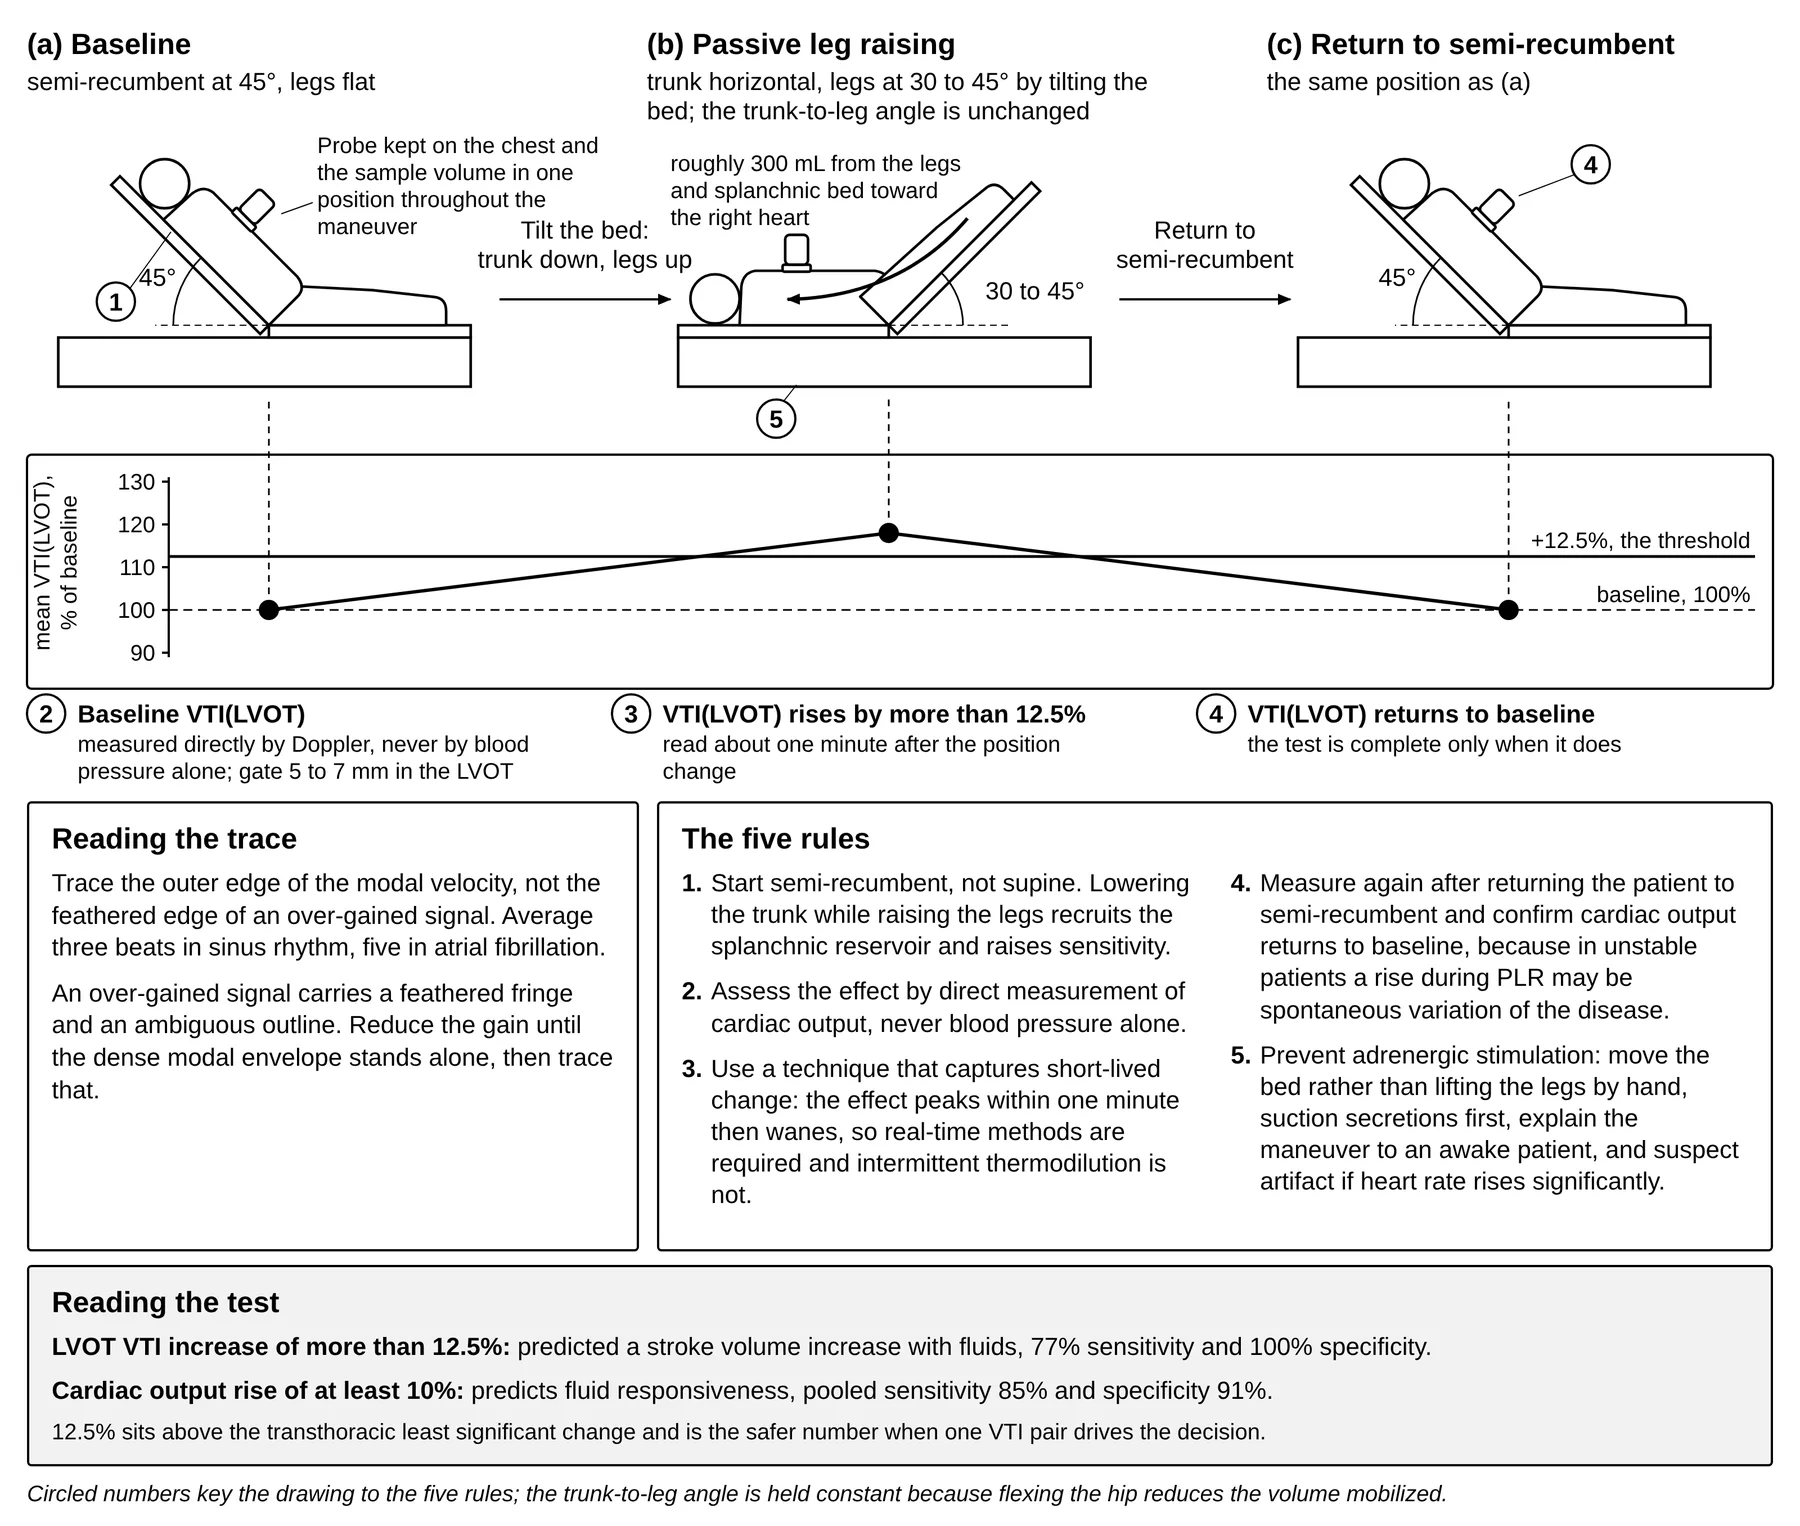
Thresholds depend on what is measured (Table 8.1). The original validation, in 71 ventilated patients of whom 31 had spontaneous breathing activity or arrhythmia, showed PLR judged on aortic blood flow performing far better than PLR judged on pulse pressure,3 and the meta-analysis of 21 studies and 991 patients confirmed this with an area under the curve of 0.95 for cardiac output against 0.77 for pulse pressure.11 An umbrella review of seven diagnostic meta-analyses, 123 studies and 10,300 mechanically ventilated adults ranked the tests by their pooled areas under the curve: the tidal volume challenge 0.96 (95% CI 0.94–0.97), the end-expiratory occlusion test 0.95 (0.92–0.96), PLR 0.91 (0.88–0.93), pulse pressure and stroke volume variation 0.87–0.88, and the pleth variability index and IVC variation 0.82–0.83, with tidal volume the main effect modifier; the two last tests, it concluded, should not be used in isolation.35 Where pulse pressure variation is all that is available at a low tidal volume, its fall during a PLR recovers the test, since across five studies and 474 patients an absolute change in pulse pressure variation (cutoffs -1 to -2.5 points, mean and median -2) predicted responsiveness with an area under the curve of 0.91 (95% CI 0.88–0.93), sensitivity 0.88 and specificity 0.83.36 The ASE quotes the echocardiographic version, in which an LVOT VTI increase of more than 12.5% predicted a stroke volume increase with fluids with 77% sensitivity and 100% specificity, outperforming changes in left ventricular dimensions or mitral inflow.14 That 12.5% sits above the transthoracic LSC and is the safer number when one VTI pair drives the decision.33
PLR is contraindicated in intracranial hypertension, is impractical during most surgery, and probably yields false negatives with venous compression stockings.2 Intra-abdominal hypertension is the contested limitation. False negatives from splanchnic sequestration or an IVC waterfall effect have been proposed, but the study raising the concern did not measure intra-abdominal pressure during the maneuver, and in such patients PLR was observed to decrease the resistance to venous return, the opposite of the proposed effect, although the reviewers call for further studies.1,28 A negative PLR in a tense abdomen should therefore be treated as uncertain, and it does not prove unresponsiveness.2,32
Mini-fluid challenge
A conventional 500 mL challenge tests responsiveness only by delivering the treatment, since a negative answer arrives after the fluid has been given, and repeated challenges easily deliver 2,000 to 2,500 mL of ineffective volume in a day.1 In 39 ventilated patients, 100 mL of hydroxyethyl starch over one minute produced a subaortic VTI change that predicted the response to a 500 mL total expansion, with an area under the curve of 0.92 (95% CI 0.78–0.98). In the 29-patient subgroup in whom pulse pressure variation and CVP were also available the areas under the curve were 0.90 (0.74–0.98) for the mini-challenge, 0.55 (0.35–0.73) for pulse pressure variation and 0.61 (0.41–0.79) for CVP.8 The statistically optimal threshold was 6%, below the resolution of echocardiography, so 10% is used even at some cost in accuracy.1 Current practice infuses 100 to 150 mL over 60 to 120 seconds with a pooled threshold averaging about 5%, which is again why the probe must not leave the chest. Two caveats remain, in that most validation studies predicted the response to a total bolus including the mini-challenge itself, possibly inflating reliability, and the fluid given still cannot be removed.2 If a full challenge is used instead, 4 mL/kg over 5 minutes is the smallest volume shown reliably to raise Pmsf.1,22
End-expiratory occlusion and the combined occlusion test
Each insufflation raises intrathoracic pressure and impedes venous return; holding the ventilator in expiration removes that cyclical impediment and raises preload for the duration of the hold. A 15-second end-expiratory occlusion raising cardiac output by more than 5% identifies preload responsiveness, and the hold must not be shorter than 15 seconds, the time the preload change needs to cross the pulmonary circulation. The test needs no repositioning and stays valid at low tidal volume, low compliance, in arrhythmia and with modest spontaneous respiratory activity, and it was valid at 5 and at 15 cm H2O of positive end-expiratory pressure (PEEP) in acute respiratory distress syndrome; it fails only in non-intubated patients and those who break the hold.1,2
The 5% threshold is below echocardiographic resolution, so with a probe the test is done differently. Adding a 15-second end-inspiratory hold, separated from the expiratory hold by resumed ventilation, produces an opposite VTI change. Summing both changes in absolute value identifies responsiveness at 13% in the 2022 review and 15% in the 2016 review, both compatible with transthoracic precision, whereas used alone the LVOT VTI threshold is 4% for the expiratory hold and a fall of more than 5% for the inspiratory hold, and neither is trustworthy from a single pair.1,2 Reported limitations needing confirmation are the prone position and laparoscopic surgery.2
8.4 Heart-lung interaction indices, and where the IVC fails
T1T2 Use aortic velocity variation or SVC collapsibility when the ventilator supplies the preload change; the IVC index fails too often to be the primary test.
Respiratory variation in aortic peak velocity (delta Vpeak) is the difference between the maximal and minimal peak velocity over one respiratory cycle divided by their mean. In 19 sedated, ventilated septic shock patients with preserved left ventricular systolic function it was 20 ± 6% in responders and 10 ± 3% in non-responders, while the indexed left ventricular end-diastolic area did not differ between the groups at all, so in the same patients the dynamic index succeeded where the static chamber size failed.4
Two 2004 studies fixed the caval thresholds still quoted. The IVC distensibility index dIVC, (Dmax - Dmin)/Dmin, discriminated responders at 18% in 23 septic patients ventilated for acute lung injury.5,37 Respiratory variation in IVC diameter of 12% identified responders in 39 patients with septic shock and correlated closely with the fluid-induced rise in cardiac output (r = 0.82).6 Reported caval thresholds span 12% to 40%,1 the index is not defined the same way in every paper (the first 2004 study divides the diameter change by the minimum diameter),5 and a threshold from one paper cannot be applied to a measurement made by another's method.
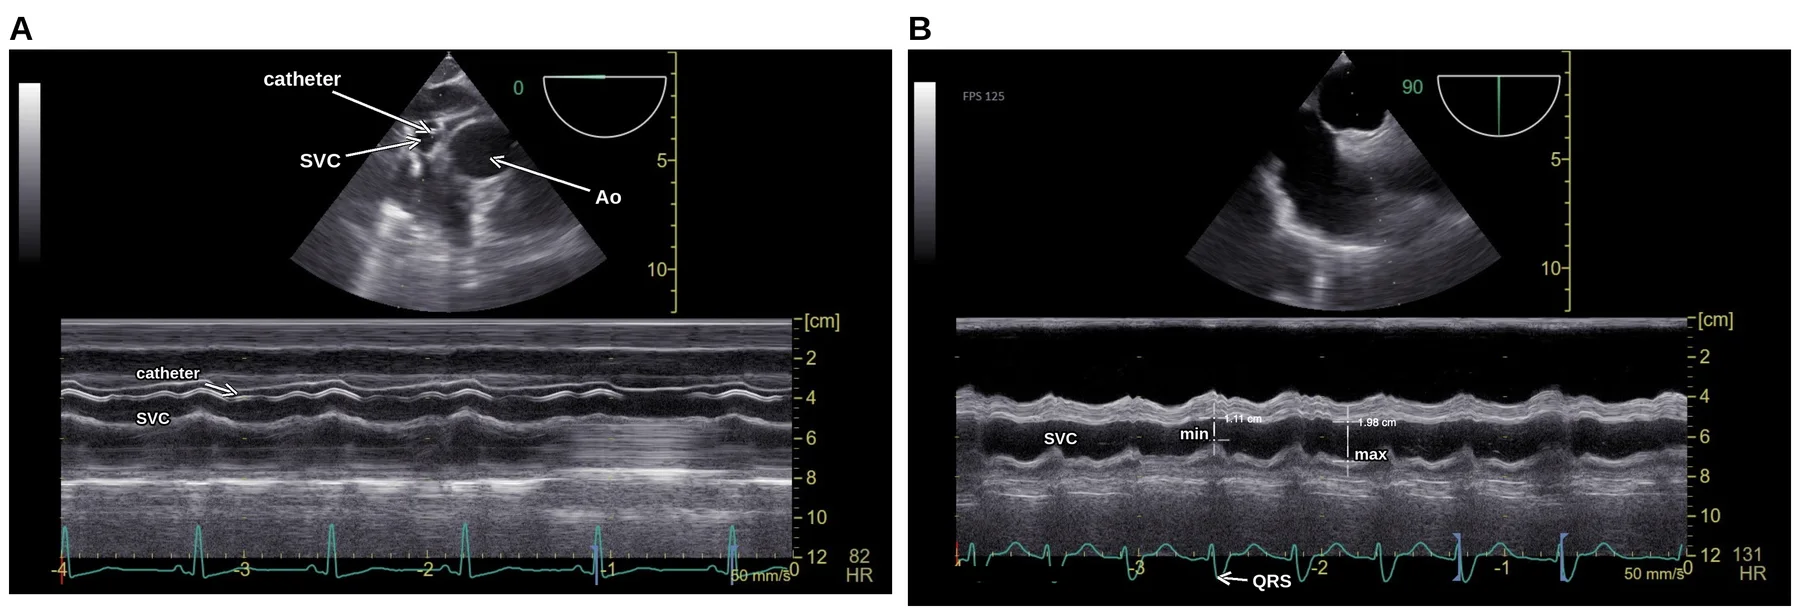
SVC collapsibility requires TEE and is calculated as (maximum expiratory diameter - minimum inspiratory diameter)/maximum expiratory diameter, validated in 66 septic shock patients against a cardiac index rise of at least 11% after 10 mL/kg of starch over 30 minutes.7 The multicenter comparison of 540 ventilated patients confirmed the pattern. LVOT peak velocity variation had the best sensitivity, SVC collapsibility the best specificity with an area under the curve significantly greater than IVC variation (p = 0.02) and pulse pressure variation (p = 0.01), and SVC was the only index measurable in nearly every patient (99.6% versus 78.1% for IVC).9 That combination is the argument for passing a TEE probe when the transthoracic answer is equivocal (Figure 8.2).
Таблиця 8.1. Dynamic tests of preload responsiveness with their published thresholds and performance
| Index | Threshold as published | Performance | Source |
|---|---|---|---|
| PLR, aortic blood flow (esophageal Doppler) | Increase ≥10% | Sensitivity 97%, specificity 94%; n=71 ventilated, 31 with spontaneous effort or arrhythmia | 3 |
| PLR, cardiac output (any real-time method) | Increase 10 ± 2% | Pooled sensitivity 0.85, specificity 0.91, AUC 0.95; 21 studies, 991 patients | 11 |
| PLR, arterial pulse pressure | Increase ≥12% | Sensitivity 60%, specificity 85%; pooled sensitivity 0.56, specificity 0.83, AUC 0.77 | 3, 11 |
| PLR, LVOT VTI (ASE) | Increase >12.5% | Sensitivity 77%, specificity 100%; small critically ill series | 14 |
| Mini-fluid challenge, 100 mL over 1 min, subaortic VTI | Increase ≥10% (statistical optimum 6%) | Sensitivity 95%, specificity 78%, AUC 0.92; n=39 | 1, 8 |
| End-expiratory occlusion, cardiac output | Increase >5%, hold of at least 15 s | Needs precise real-time cardiac output; invalid if the hold is broken | 1, 2 |
| Combined end-expiratory plus end-inspiratory occlusion, LVOT VTI | Sum of absolute changes ≥13% (2022) or 15% (2016) | Chosen because it exceeds transthoracic precision | 1, 2 |
| Respiratory variation of aortic peak velocity (delta Vpeak) | ≥12% | Sensitivity 100%, specificity 89%; n=19 septic shock, preserved LV function | 4 |
| Respiratory variation of maximal LVOT velocity | ≥10% | Sensitivity 79%, specificity 64%; feasible in 78.0% of 540 patients | 9 |
| IVC distensibility, dIVC = (Dmax - Dmin)/Dmin | 18% | Sensitivity 90%, specificity 90%; n=23 septic, ventilated | 5, 37 |
| IVC respiratory variation | 12% | Positive predictive value 93%, negative predictive value 92%; n=39 septic shock | 6 |
| IVC variation (multicenter) | ≥8% | Sensitivity 55%, specificity 70%; feasible in 78.1% | 9 |
| SVC collapsibility, TEE | 36% | Sensitivity 90%, specificity 100%; n=66 septic shock | 1, 7 |
| SVC collapsibility, TEE (multicenter) | ≥21% | Sensitivity 61%, specificity 84%; feasible in 99.6% | 9 |
| Pulse pressure or stroke volume variation | 12% (median, IQR 10–13%) | Pooled sensitivity 88%, specificity 89%; gray zone 9–13% holding 24% of observed values | 1 |
| Conventional fluid challenge, 500 mL | Cardiac output increase 15% | Irreversible; needs direct cardiac output measurement | 1 |
The situations in which the IVC fails
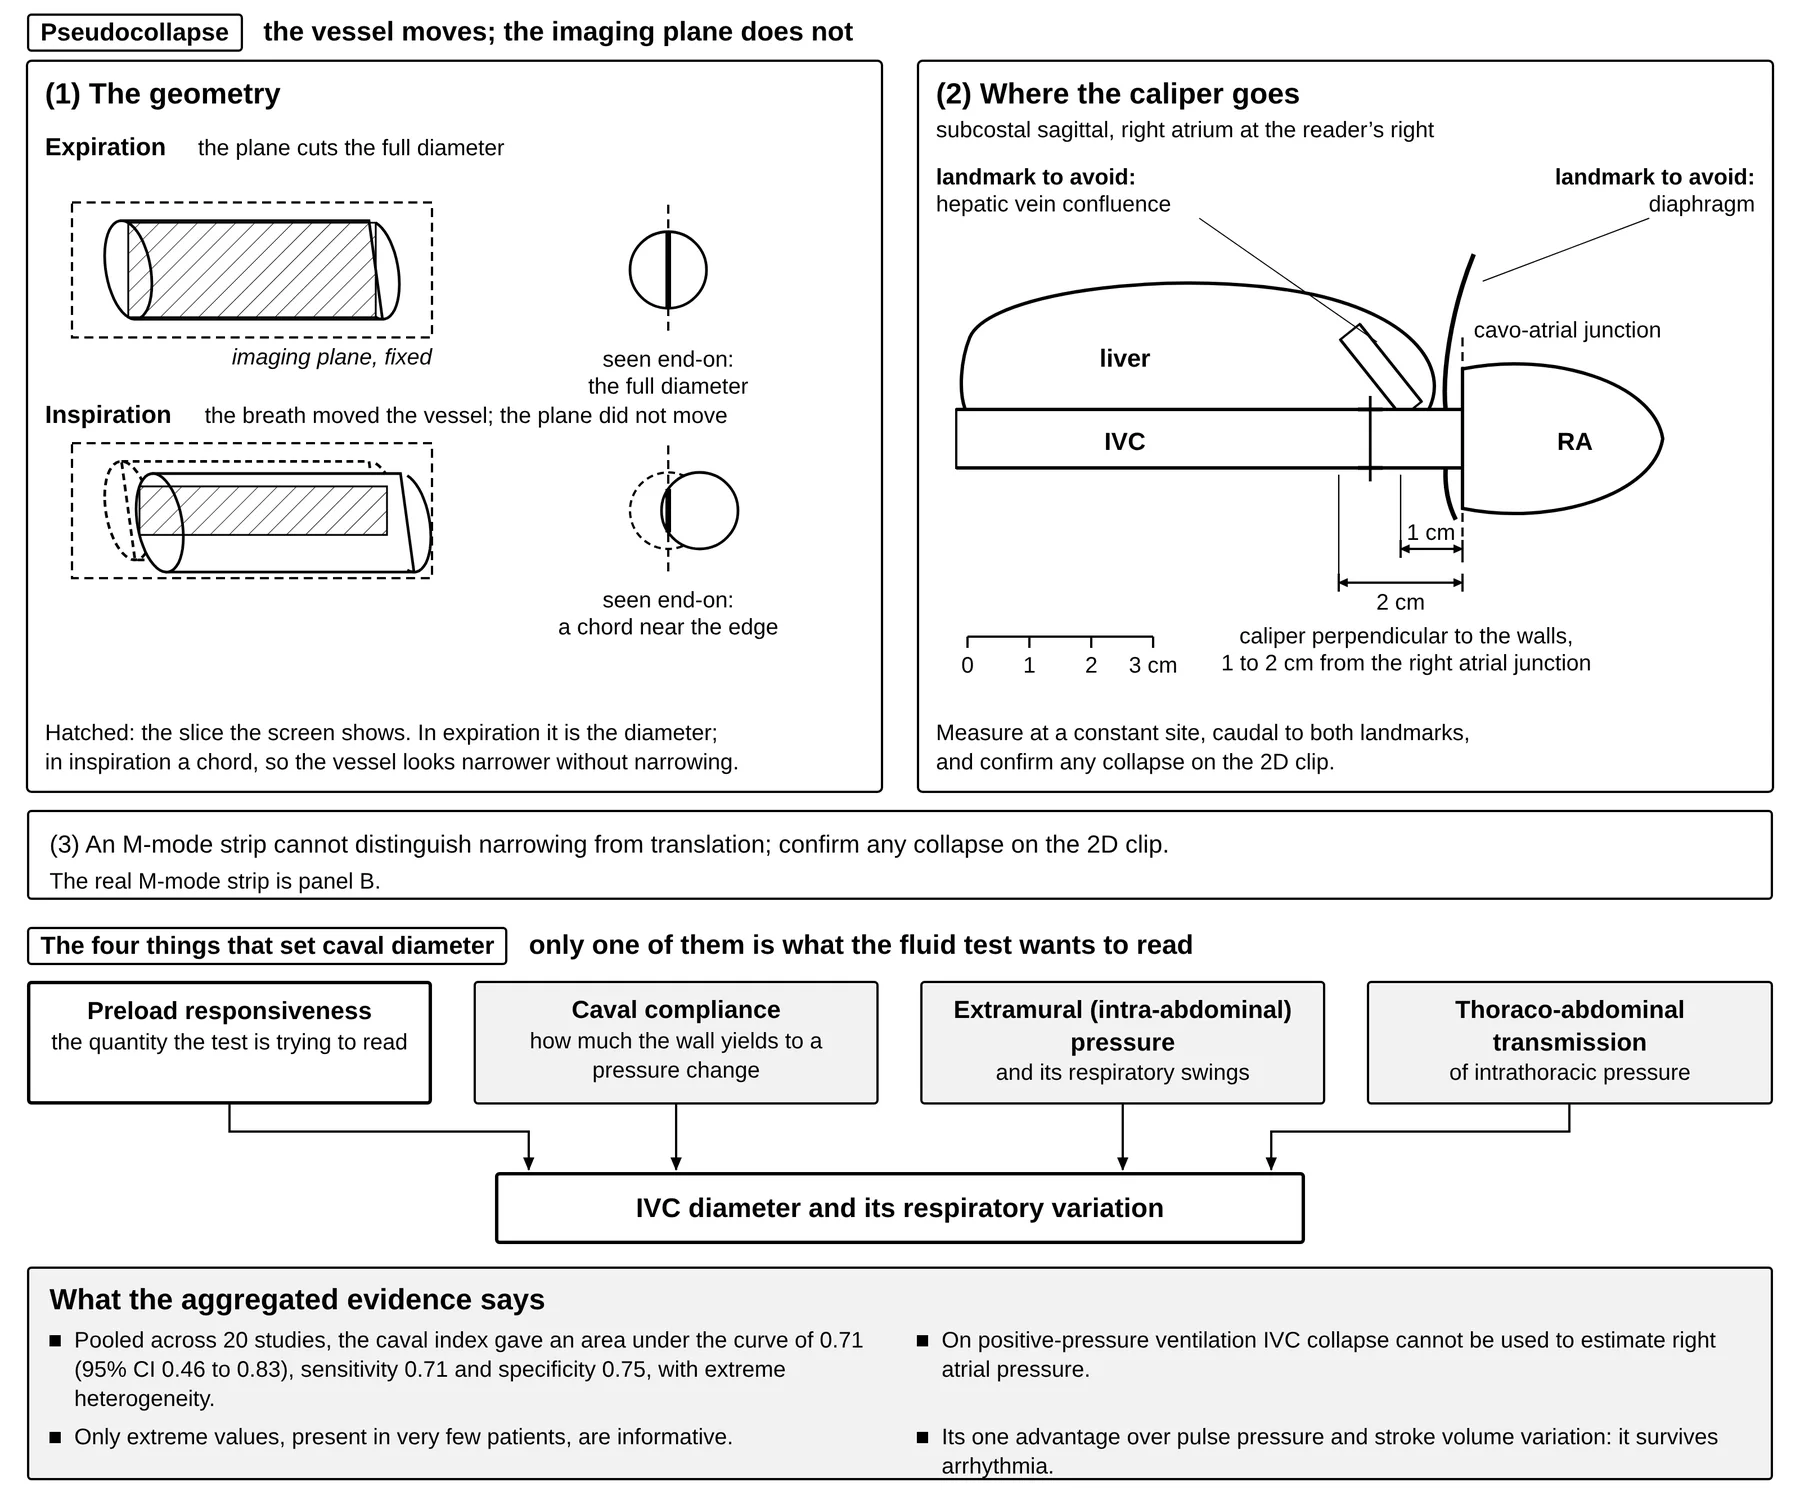
Aggregated data are far less flattering than the 2004 landmarks. A systematic review and meta-analysis of 20 studies of the caval index found a pooled area under the curve of 0.71 (95% CI 0.46–0.83), sensitivity 0.71 (0.62–0.80) and specificity 0.75 (0.64–0.85) with extreme heterogeneity, concluding that IVC diameter and its respiratory variations do not seem a reliable way to predict fluid responsiveness.10 An earlier meta-analysis of eight studies pooled sensitivity at only 76% with specificity 86%,1 and a large study confirmed that only extreme values, observed in very few patients, were informative (Table 8.2 and Figure 8.3). Physiologically, caval diameter is not a pure function of preload responsiveness, because it is also set by caval compliance, by extramural (intra-abdominal) pressure and its respiratory swings, and by thoraco-abdominal transmission of intrathoracic pressure.2 In a multicenter study of 540 ventilated patients in shock, the end-expiratory IVC diameter could not be obtained in 22%; a diameter of 13 mm or less predicted a response to PLR and one of 25 mm or more predicted its absence, each with a specificity of at least 80%, but 71% of the patients measured lay between the two values, and the relation was weaker when intra-abdominal pressure was 12 mm Hg or more, as it was in 30%.39
Відео. Нижня порожниста вена, субкостальне вікно. Архів автора.
Таблиця 8.2. Situations in which the IVC index fails and the effect of each on its reading
| Situation | Effect on the IVC index | Source |
|---|---|---|
| Spontaneous breathing, including effort in an intubated patient | Accuracy falls; only very high amplitude variation indicates responsiveness | 1, 2 |
| Low tidal volume | Reduces the intrathoracic pressure swing that generates the signal (false negatives) | 1, 2 |
| Low lung compliance | Reduces transmission of alveolar to intravascular pressure (false negatives) | 1, 2 |
| Intra-abdominal hypertension | Extramural pressure dominates the diameter change; diagnostic value becomes very low | 2 |
| Right ventricular dysfunction, significant tricuspid regurgitation | Impeded venous return gives a plethoric IVC unrelated to fluid responsiveness | 32 |
| High PEEP, large intrathoracic swings (asthma), pressure-supported breathing | Alters the respiratory signal independently of volume status | 32 |
| Positive-pressure ventilation, when the question is RAP | IVC collapse cannot be used to estimate RAP; a dilated non-collapsing IVC is the norm | 12, 13, 14 |
| Measurement site drift along the vessel | The site of measurement changes the accuracy of the variability index | 2 |
| Translational pseudocollapse | The vessel moves out of plane and mimics collapse; 2D is preferable to M-mode | 13, 14, 32 |
| Normal variants: athletes, young adults, pregnancy | A dilated IVC can be normal; portal pulsatility also occurs in healthy athletic volunteers | 12, 13, 16 |
| Tidal volume challenge judged by IVC distensibility instead of pulse pressure variation | Diagnostic value notoriously insufficient | 2 |
Caval variation keeps one advantage over pulse pressure and stroke volume variation, because it can still be used in cardiac arrhythmia.1 The field's own reviewers are blunt about the index's limitations, and trainees who have learned that the IVC is the volume test should hear it. Given these limitations, they write, it is surprising that caval distensibility is so often treated as the key index for assessing fluid requirements in POCUS, and its ease of measurement does not compensate for its lack of reliability, since preload responsiveness is better assessed with PLR, the combined occlusion tests, or a mini-fluid challenge (Figures 8.2 and 8.3).2
8.5 What ASE says: the IVC, right atrial pressure and echocardiography as a monitor
T1 The ASE keeps the IVC in the pressure-estimation role, and that role belongs to Chapter 6. The 2015 rule converts caval caliber and its collapse on a sniff into a single reported RAP, and the tiers of that algorithm, the site and respiratory phase at which the vessel is measured for it, and the ICU caveats that qualify it are set out in section 6.4.12 The monitoring guideline adds that IVC collapsibility should not be used to monitor RAP during positive-pressure ventilation, and that a change in the collapsibility index of more than 10%, or a crossing of the 50% boundary, is meaningful.14
The same vessel does three other jobs and all three are this chapter's. Section 8.4 reads it as an index of preload responsiveness, with the distensibility and variation thresholds of Table 8.1 and the conditions of Table 8.2 that invalidate them; section 8.6 reads a plethoric cava as a tolerance sign that is weak on its own; and section 8.10 shows how the research literature has combined the four windows, with the IVC measured there at its own caliper site and in its own respiratory phase. When the ventilator dictates caval caliber, filling no longer does, and the vessel is a poor index of volume for the same reason that it is a poor index of pressure, which is the argument of section 8.4 restated in the guideline's own terms.
On echocardiography as a monitor, the guideline counts a study as monitoring once the same patient is reassessed after a diagnostic examination to guide management, and it notes that echocardiography cannot monitor continuously and demands meticulous sample-volume placement. Its per-scenario recommendations are modest, and the caval collapsibility index is the one parameter it names in all three of hypotension, sepsis and respiratory failure; Table 11.8 lists the full set with the change that counts as meaningful for each. Hypovolemia is monitored with the end-diastolic dimension, because in hypovolemia both dimensions fall whereas with low systemic vascular resistance the diastolic dimension is normal and only the systolic is small; in septic shock the guideline accepts IVC collapse as a substitute for CVP and LVOT stroke distance as a substitute for cardiac output within a goal-directed framework. Supporting data for critical care monitoring rate only B2, non-comparative observational studies, with no formal comparison of Doppler monitoring against other monitors in sepsis, respiratory failure or trauma. Quantitative measurements used to guide therapy carry a training requirement of their own, given in section 1.4, and the user must know the interobserver variability of every measurement tracked.14
8.6 Fluid tolerance: the second question
T2 Ask tolerance separately: look for pulsatility where flow should be continuous, in the portal and intrarenal veins, and read it as pressure transmitted into an encapsulated organ in its context, never as a number that mandates fluid removal.
Responsiveness asks whether a bolus will raise cardiac output; tolerance asks whether the patient can absorb it without organ injury, and the two are separate questions asked of the same patient. A ventricle on the steep part of its curve recruits stroke volume from a bolus whatever the state of the venous circulation behind it, so a positive test says nothing about the cost of obeying it. This is the force of the third condition in section 8.1, that the risk of fluid overload be acceptable, and of the consensus position that preload responsiveness implies neither that fluid may be given safely nor that it should be given at all.24,28 The patient who is responsive and intolerant at once is the one in whom the test must not be obeyed, which is why tolerance is asked as its own question, with its own measurements, and cannot be inferred from the responsiveness answer. Fluid tolerance, understood here as the degree to which a patient can receive volume without organ injury, is a concept for which a working definition and bedside clinical signals have been proposed,40 and the fluid intolerance syndromes that make the question urgent are increased extravascular lung water, capillary leak, intra-abdominal hypertension and systemic venous congestion.41
Two bedside signals answer the tolerance question and neither is one of this chapter's dynamic tests. On the pulmonary side, an anterior A-profile with lung sliding is compatible with a pulmonary artery occlusion pressure of 18 mm Hg or less with 93% specificity and 97% positive predictive value, and conversion from A lines to B lines during fluid administration marks the point at which fluid is stopped;42 the lung signs themselves are developed in Chapter 15. On the venous side the signal is a waveform.
The liver and the kidney are encapsulated organs: a rise in venous pressure inside a capsule that cannot expand is carried through the sinusoids and the interstitium into the organ's own veins, and the organ pays twice, through a smaller arteriovenous gradient and through interstitial edema raising interstitial pressure, most of all when cardiac output is low.16,17 Pressure, volume, preload, venous congestion and effective circulating volume are not synonymous: a wedge pressure is not volume status, a central venous pressure is not congestion, an IVC diameter is not fluid responsiveness, and even venous Doppler abnormalities alone do not universally mandate fluid removal. The body does not congest symmetrically; organs experience venous hypertension before many cardiac indices become abnormal, particularly when cardiac compliance is preserved, so a normal wedge pressure does not imply the absence of harmful congestion.15 The pressure that opposes venous return is transmitted backward into the veins draining the organs once the compliant reserve of section 8.1 is spent and the damping described in section 6.4 is lost, so a pulse appears in vessels whose flow should be smooth. Chapter 17 comes at the same fact from the other direction, since pulsatility fails as a vein-versus-artery discriminator during vascular access precisely because central veins pulsate when tricuspid regurgitation is significant or right heart pressures are high. The hepatic vein is read in section 6.4, where it lies close enough to the atrium to serve as a pressure estimate and its signs are collected in Table 6.3. Sections 8.7 and 8.8 carry the argument out to the portal vein and the intrarenal veins, where the same pressure arrives having crossed a capillary bed, so that a pulsatile trace there is a statement about the organ; section 8.9 sets out the evidence that the pressure injures those organs, and section 8.10 asks what the four windows add up to: the congestion phenotypes that identical filling pressures can hide, and the research score that packaged the windows into one number, with what that number has and has not been shown to do.
One caution stays here because the vessel is this chapter's own. The IVC does not serve as the tolerance test, because a plethoric IVC alone had a specificity of only 41% for congestive acute kidney injury,16 and a dilated IVC can be normal in athletes, young adults and pregnancy.12,13 In the research score of section 8.10 its only part is an entry criterion, a diameter of 2 cm or more measured at a site and in a respiratory phase of its own, and it adds nothing to the organ-level reading once that criterion is met.
8.7 Pulsatility where flow should be continuous: the portal vein
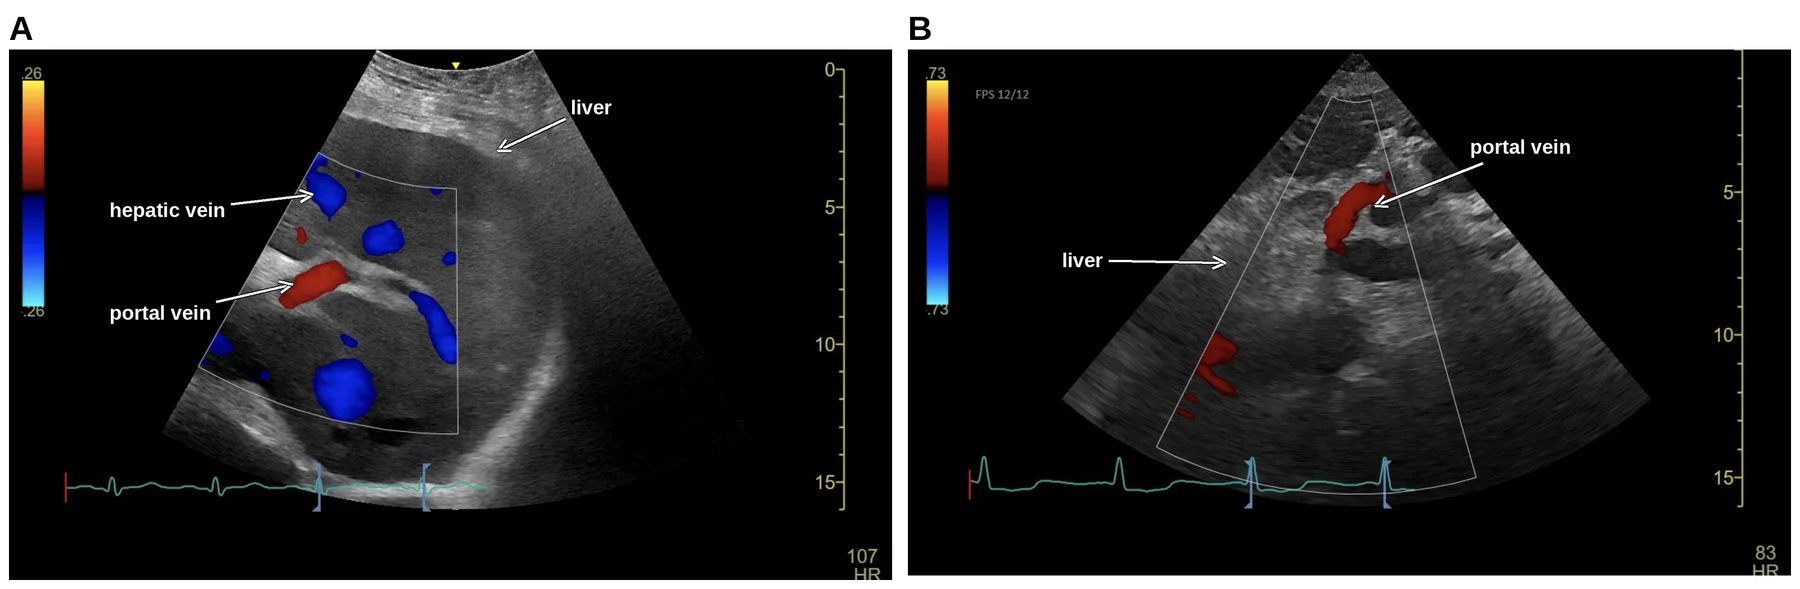
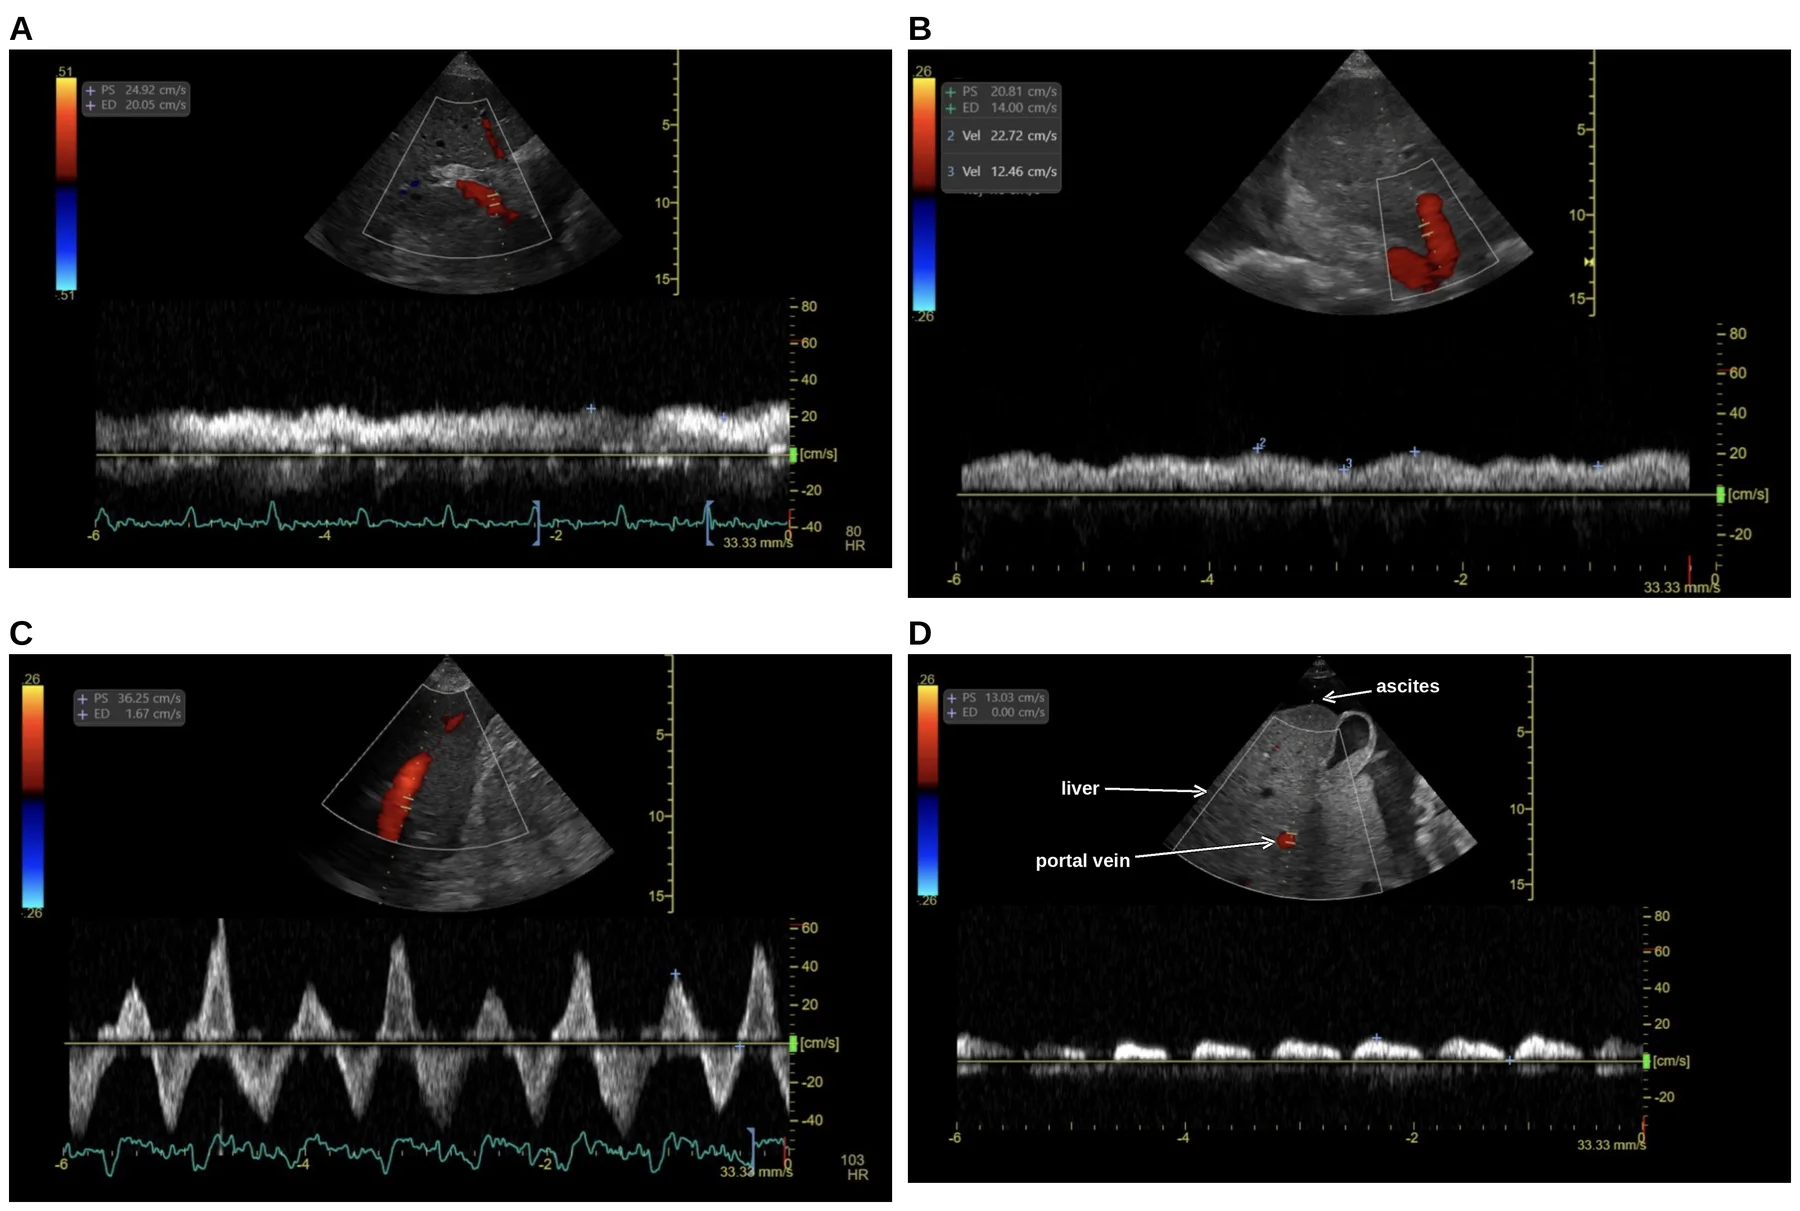
The portal vein is the first bed in which a pulse is abnormal by definition, and it is informative because the hepatic sinusoids insulate it. At that distance from the heart normal portal flow is undulating, phasic and hepatopetal at about 20 cm/s (Figure 8.4). As congestion rises, the retrograde hepatic vein flow generated by atrial contraction is transmitted up through the sinusoids and impedes hepatopetal flow, an effect compounded once systolic reversal appears, until pulsatility produces a biphasic, back-and-forth pattern.17 Because the sinusoids damp linear transmission of RAP, the normal portal vein pulsatility fraction, (Vmax - Vmin)/Vmax × 100%, is below 30%; from 30% the pulse of right atrial pressure is being transmitted through the sinusoids, and at 50% or more, with flow reaching the baseline or reversing, the transmission is marked (Figure 8.5).17,19 The 30% and 50% thresholds were adopted in the congestion literature "based on the previous studies", with no fresh derivation.16
Відео. Печінкова вена, кольоровий допплер. Архів автора.
Their provenance is perioperative. In 115 cardiac surgery patients a post-procedural fraction of 50% or more, present in 21 (18.3%), carried an odds ratio of 5.83 for major complications and went with right ventricular dysfunction,43 and in the cardiac surgery cohort that later served to derive the combined score of section 8.10, portal pulsatility was associated with acute kidney injury (AKI) as a time-dependent variable (hazard ratio 2.09).44
Settings decide whether the trace is measurable at all. A phased array or a curvilinear transducer will serve and both may be needed; a cardiac preset may default to a Doppler scale near 100 cm/s, which should be reduced to about 40 cm/s, with the sweep speed at 50 or 66.7 mm/s. Too high a scale fails to detect color flow and suggests falsely reduced flow or thrombosis, and too low a scale causes aliasing that mimics turbulence.19 Every setting quoted here comes from the published technique reviews.19,45
What raises the portal pulsatility fraction besides congestion
Liver disease alters the waveform independently of the right heart. In chronic liver disease with portal hypertension the portal pulsatility index was lower than in healthy subjects (0.23 ± 0.08 versus 0.39 ± 0.1) and lower again in Child-Pugh class C than class A.46 In cirrhosis the trace may show low-velocity continuous or frankly hepatofugal flow, a raised pulsatility fraction may arise from arteriovenous connections with a normal RAP (Figure 8.5 D), and in a stiff liver sinusoidal transmission is attenuated, so the vein may stay non-pulsatile through severe congestion.17,19 Pulsatile portal flow and IVC dilatation have both been reported in healthy athletic volunteers, and lean subjects may show a raised pulsatility index with no rise in RAP.16,19
Loading conditions move the number as much as disease does, and the two interventional studies disagree about which loading condition matters. A PEEP trial in 29 ventilated patients after cardiac surgery raised the portal pulsatility index from 9% at PEEP 0 cm H2O to 34% at 10 and 45% at 15 cm H2O, with CVP rising at every step and the hepatic vein systolic-to-diastolic ratio falling from 2.0 to 1.08.47 A randomized crossover study in 31 cardiac surgery patients found the opposite, in that portal pulsatility fraction and renal venous stasis index rose in the raised-legs position and were unchanged by PEEP increments, hepatic and renal flow patterns were likewise affected by position alone, nothing changed with phenylephrine, and the authors judged the absolute changes small enough to call the indices clinically robust.48 A reader interpreting a portal vein after a recruitment maneuver, or with the legs up, should know the literature has not settled which manipulation moves the trace. PLR, the test of section 8.3, is one of those manipulations, since the raised-legs position is what moved the portal fraction in the crossover study, so a trace recorded during or immediately after a responsiveness test is not the trace the patient had before it.48
8.8 The intrarenal veins, and the beds with less evidence
Intrarenal venous Doppler is sampled in the interlobar or arcuate vessels, and a trace counts as adequate only when arterial flow above the baseline and venous flow below it are both clearly seen for two or more cardiac cycles. The normal venous signal is continuous and monophasic below the baseline (Figure 8.6 B). With congestion it becomes pulsatile, then interrupted and biphasic, the two components corresponding to the systolic and diastolic waves of the hepatic vein, and finally the systolic component shrinks and vanishes, leaving a monophasic diastolic-only wave. Flow is abnormal when discontinuous, whether biphasic or diastolic-only.17
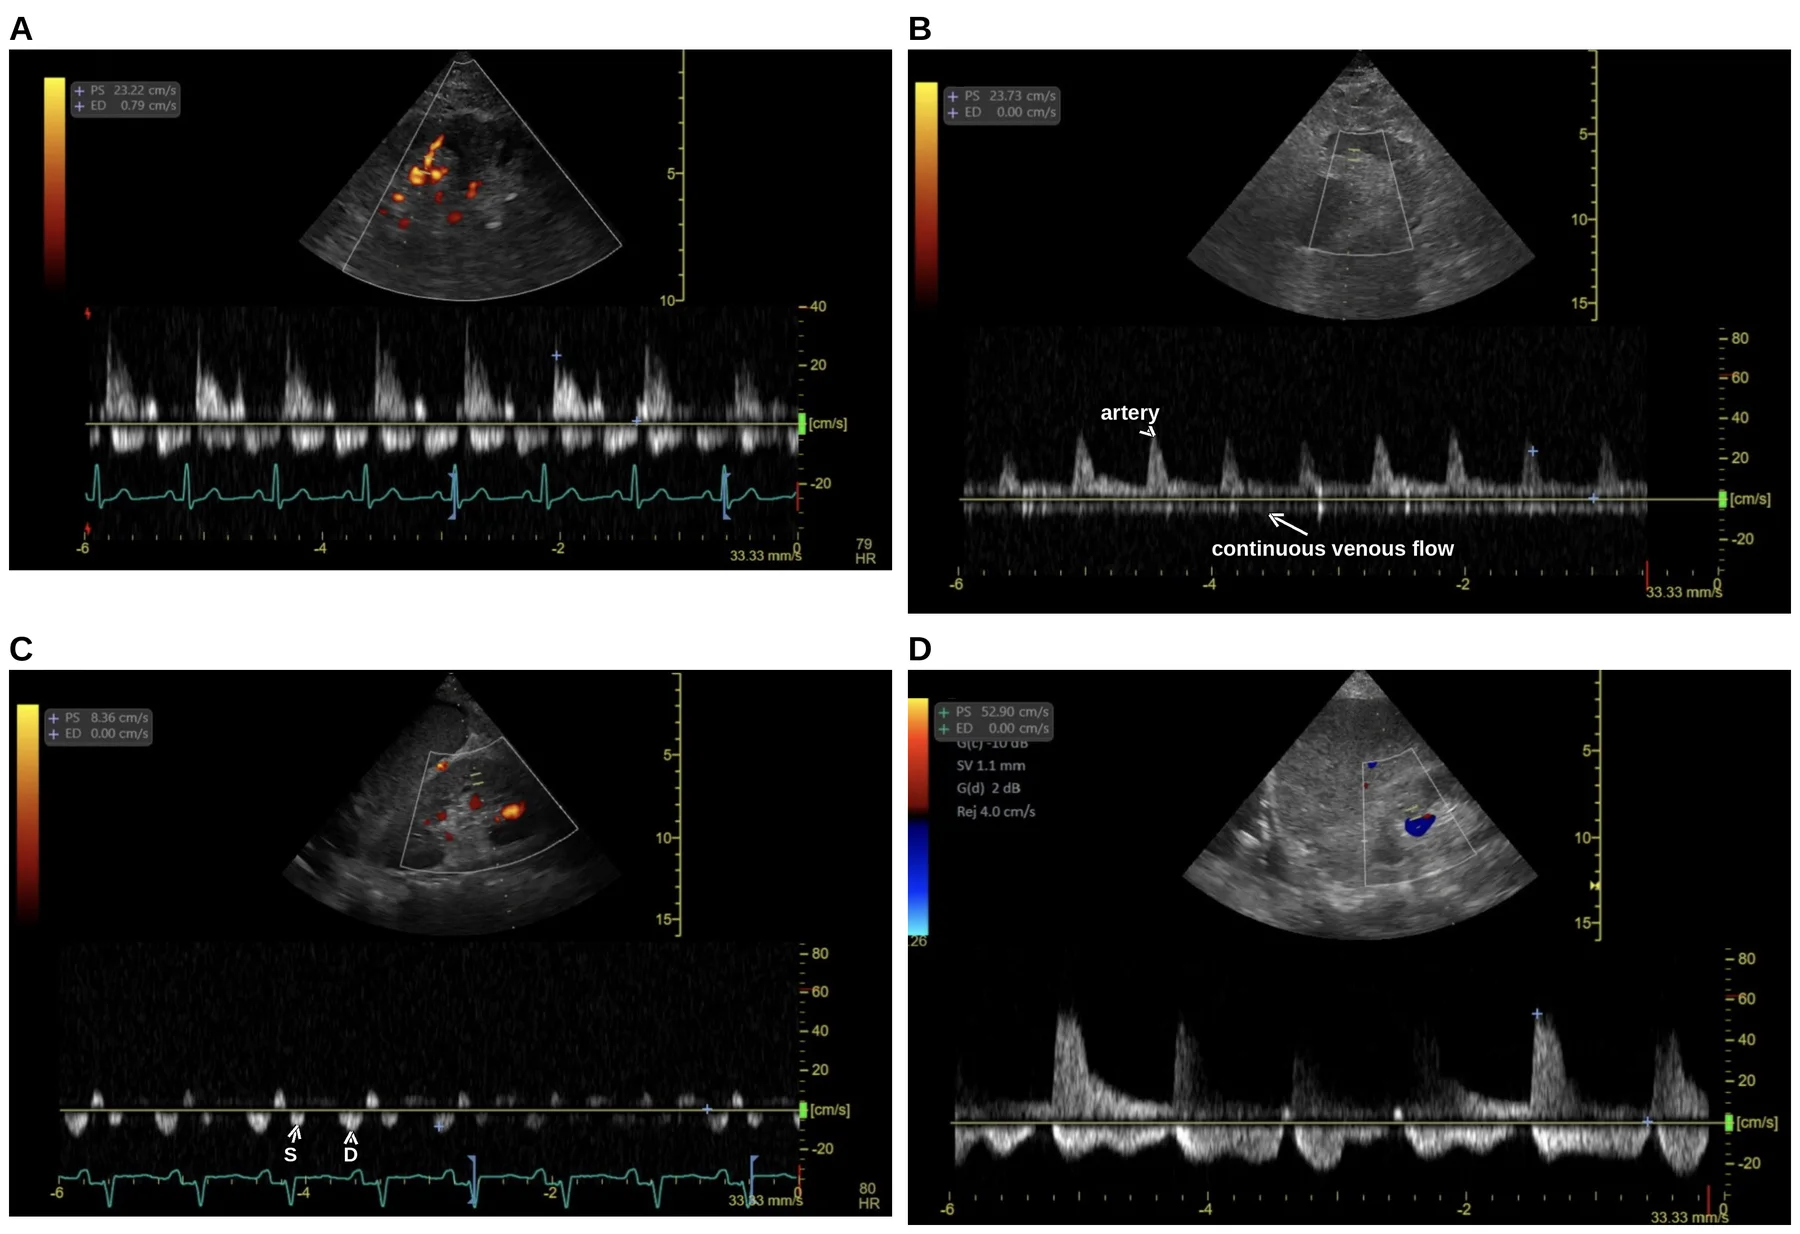
The classification is worth tracing to its origin, because the origin includes the pressures. In 217 heart failure patients the three patterns stratified mean RAP cleanly, continuous 5.4 ± 2.5, biphasic 9.5 ± 3.5 and monophasic 14.9 ± 4.3 mm Hg; the monophasic pattern carried the worst one-year prognosis, and the venous patterns depended on RAP while the arterial resistance index did not.49 A continuous version of the same idea, the renal venous stasis index, rose stepwise across those categories in 205 patients catheterized for pulmonary hypertension, its highest tertile independently predicting disease progression or death (hazard ratio 4.72).50
What the intrarenal signal has shown in critical illness, and how often it cannot be obtained
In critical illness the signal behaves less obediently. Among 38 ventilated septic patients, 22 (57.9%) had a discontinuous pattern, which was not associated with CVP at all (9.24 versus 10.65 mm Hg, p = 0.154, printed as cm H2O in the paper's abstract) yet was associated with a composite of KDIGO stage 3 AKI or death (odds ratio 9.67).51 In 114 general ICU patients hepatic vein abnormalities predicted major adverse kidney events at 30 days (odds ratio 4.0) while renal vein abnormalities did not.52 Technically this is the hardest of the four windows, because it more often gives ambiguous results "in patients with poor ultrasound penetration or with devices offering less-sensitive Doppler capabilities".16 It needs an abdominal or trauma preset with the Nyquist limit below 20 cm/s and increased color gain, a curvilinear transducer is often more effective in the critically ill, and it is difficult in anyone who cannot hold a breath or follow instructions.19 Parenchymal renal disease may itself alter the waveform,17 and structural change in liver or kidney is a general reason for caution.45 Agreement suffers accordingly, since on handheld devices the renal vein was the one component with reduced concordance, kappa 0.55 against 0.653 on conventional equipment.53 Across four attendings of different specialties, agreement on the combined assessment was kappa 0.71 and intraclass correlation 0.83, better with a concurrent electrocardiogram, but for the renal component alone it was 0.32 and 0.48.54
The internal jugular, femoral and splenic veins, where the evidence is thinner still
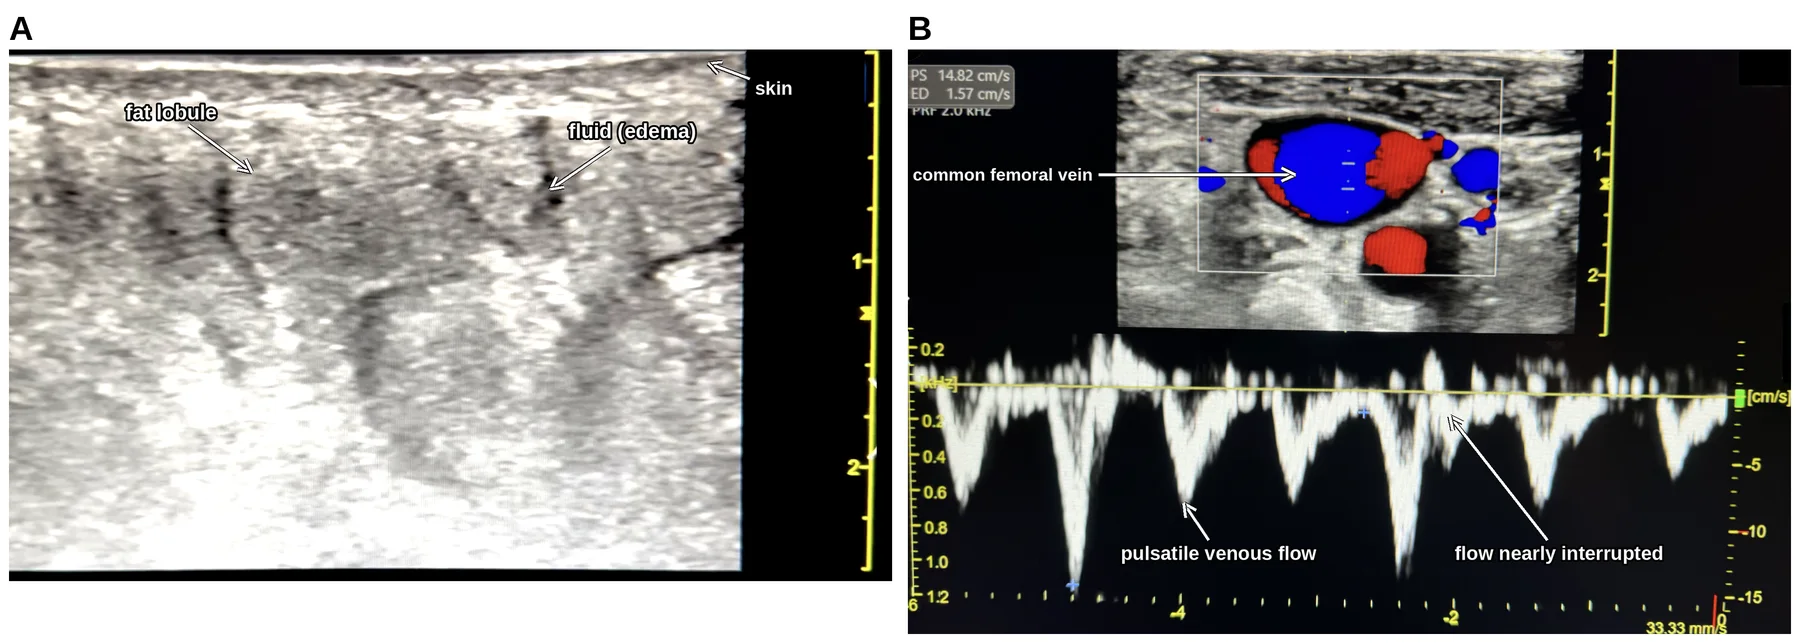
Three further beds have published evidence and it is thin. The internal jugular vein is the anatomical home of the waveform read in section 6.4. A four-stage classification of it, comparing internal jugular and carotid cross-sectional areas at 45 degrees and at 60 to 90 degrees in 117 heart failure patients undergoing pulmonary artery catheterization (136 enrolled), gave a stepwise rise in mean RAP across stages, a C-statistic of 0.785 for RAP of 10 mm Hg or more and a positive predictive value of 85% for stages 3 and 4.55 The common femoral vein is a newer addition to the venous examination.45,56 It drains through the iliac veins into the IVC and transmits pressure changes with worsening congestion, and it is examined with a linear transducer 2 to 3 cm below the inguinal ligament.56 With increasing congestion its waveform turns from a continuous, phasic pattern into a highly pulsatile one, often with flow interruptions, which the femoral vein stasis index quantifies as the percentage of the cardiac cycle with no antegrade flow toward the heart; its distance from the heart lowers its sensitivity for elevated central pressures, but a pulsatile pattern carries high specificity and is associated with adverse outcomes including acute kidney injury (Figure 8.7).57 In 111 patients with acute decompensated heart failure, femoral venous Doppler was more sensitive but less specific than the combined abdominal assessment for AKI and lung congestion.56 Splenic pulsatility appears in a four-patient constrictive pericarditis series, normalizing after pericardiectomy and reappearing, with femoral pulsatility, when the operation acutely raised venous return and precipitated right ventricular failure.58 Beyond these three, the SVC whose collapsibility serves as a responsiveness index in section 8.4, and the hepatic vein of section 6.4, the published Doppler evidence for organ congestion is confined to the portal and intrarenal beds, and a clinician who reads congestion from another vessel is extrapolating.
8.9 What congestion does to organs
What the pressure costs is set out most completely in the paper that first combined the venous windows into one assessment: reduction of the arteriovenous gradient across an organ hampers perfusion; interstitial edema forms after prolonged elevation of capillary hydrostatic pressure across a dysfunctional endothelial barrier; in encapsulated organs such as the kidney and the brain that edema raises interstitial pressure rapidly, which decreases organ blood flow; and edema is hypothesized to impair oxygenation by lengthening diffusion distances within the interstitium.16 The renal evidence is collected in Table 8.3.
Таблиця 8.3. Venous pressure and renal outcome, from four cohorts and the proposed entity of congestive nephropathy
| Population | Finding | Source |
|---|---|---|
| 145 patients, advanced decompensated heart failure | 58 (40%) developed worsening renal function; admission CVP 18 ± 7 versus 12 ± 6 mm Hg, less frequent below CVP 8 mm Hg | 59 |
| 2,557 patients undergoing right heart catheterization | CVP associated with glomerular filtration rate and independently with death over median 10.7 years (hazard ratio 1.03 per mm Hg) | 60 |
| 137 septic ICU patients | Mean arterial pressure, central venous oxygen saturation and cardiac output did not differ by AKI status; CVP did, after adjustment for fluid balance and PEEP (odds ratio 1.22) | 61 |
| 12,778-patient ICU inception cohort | Peripheral edema carried 30% higher adjusted AKI risk, pulmonary edema none; each 1 cm H2O higher CVP carried 2% higher risk | 62 |
| Congestive nephropathy, proposed as an entity | Reversible dysfunction from falling renal venous outflow and rising interstitial pressure; CVP above 6 mm Hg associated with a steep fall in filtration rate; optimal range undetermined | 63 |
Liver, gut and brain complete the picture. In 150 patients admitted with an exacerbation of chronic heart failure a portal vein pulsatility index above 0.5 predicted elevated total bilirubin with sensitivity 81% and specificity 87%,64 and after cardiac surgery in 41 patients without liver disease growth of the retrograde hepatic venous VTI tracked positive fluid balance (c-index 0.89).65 The most instructive illustration is a near-miss. A patient listed for cholecystectomy for gallbladder wall thickening and pericholecystic fluid reported as acalculous cholecystitis had a plethoric IVC and hepatic vein and a biphasic portal vein, and echocardiography then showed an ejection fraction below 10% with a stroke volume of 18 mL; the operation was canceled.17 Among 165 outpatients with an ejection fraction of 40% or less, bowel wall thickness was greater in the 29 (18%) who were cachectic and stayed associated with cachexia after adjustment (odds ratio 1.4), RAP being the only cardiac parameter to survive.66 In two cardiac surgery cohorts, of 237 and 145 patients, portal pulsatility was associated with delirium (odds ratio 2.69) and with cognitive dysfunction (odds ratio 2.10).67
The abdomen closes the loop and is also the chief confounder. Abdominal congestion arises from compromised splanchnic capacitance and deficient abdominal lymph flow, raised intra-abdominal pressure as its extreme marker correlates with renal dysfunction in advanced congestive heart failure, and congestion-induced failure of the intestinal barrier admits bowel-derived toxins that further depress cardiac and renal function.68 In 9 volume-overloaded patients with intra-abdominal pressure of 8 mm Hg or more refractory to intensive therapy, paracentesis or ultrafiltration cut that pressure from 13 ± 4 to 7 ± 2 mm Hg with creatinine falling from 3.4 ± 1.4 to 2.4 ± 1.1 mg/dL.69 For the sonographer that is a warning, because the IVC can be compressed by raised intra-abdominal pressure independently of RAP, and in the published case in which 12 L of ascites was eventually drained, portal pulsatility remained significant after the first several liters had clinically normalized intra-abdominal pressure.17 The same condition dominates the caval diameter change of section 8.4 and leaves a negative PLR uncertain, so one abdomen can disturb both halves of this chapter's question at once.
What the organ evidence establishes, and the threshold it does not give
Congestion and low flow multiply each other's harm. Venous hypertension is most deleterious when cardiac output is low, as the derivation paper reports of Damman's cohort, and, as the same authors report of early animal experiments, only venous pressures of 25 mm Hg or more reduced glomerular filtration rate when arterial blood flow was maintained.16 Every row of Table 8.3 is an association observed in a cohort, and not one of them fixes a pressure at which to act. Congestive nephropathy has been proposed as an entity of reversible dysfunction driven by falling renal venous outflow and rising interstitial pressure, with a CVP above 6 mm Hg associated with a steep fall in filtration rate and the optimal range left undetermined.63 The boundary for the microcirculation is equally unsettled, since, as Rola and colleagues report, Vellinga and colleagues found a CVP above 12 associated with decreased tissue perfusion and sluggish capillary flow, which they termed microcirculatory tamponade.16,17 A congestive finding is therefore a statement about risk, and the number at which to intervene has to come from the patient in front of the operator.
8.10 What the four windows add up to: congestion phenotypes, and the research score
T2 Identical filling pressures can come from four different circulations, and the venous windows are read as the organ-level evidence that tells them apart; the research score that packaged the windows into one number is a research instrument, not a bedside grade.
Congestion is an organ-specific phenotype rather than a single measurement. Identical filling pressures can arise from pressure redistribution, systemic venous congestion, global cardiorenal congestion or isolated right-sided failure, each calling for a different therapy (Table 8.4). Two patients with identical filling pressures may need entirely different therapies, vasodilation for one, aggressive decongestion for another, preload preservation or mechanical circulatory support for others; the challenge is not measuring the pressure but understanding what it means within the circulation. The venous signals are therefore read with the cardiac study, the organ function and the clinical context, and with their confounders in view: severe tricuspid regurgitation produces chronically abnormal hepatic venous patterns independent of fluid status, mechanical ventilation alters venous return and intracardiac pressures, and abdominal compliance, ventricular compliance, valvular disease, pulmonary vascular resistance and vasoplegia all influence congestion physiology in ways that no single tool captures. Portal vein Doppler is not a universal truth any more than central venous pressure was.15
Таблиця 8.4. Four congestion phenotypes with similar filling pressures: what the venous windows show in each, and what the viewpoint says about treating them
| Phenotype | Pressures and venous windows | Mechanism | What follows | Source |
|---|---|---|---|---|
| Pressure redistribution | Markedly elevated left-sided filling pressures and pulmonary congestion; IVC may be plethoric; hepatic, portal and intrarenal Doppler relatively preserved; little end-organ dysfunction | Abrupt rise in afterload, impaired ventricular compliance and neurohormonal vasoconstriction, as in hypertensive pulmonary edema; the Swan-Ganz catheter can mislead the same way in severe mitral regurgitation | Vasodilator therapy and noninvasive ventilation, sometimes with modest volume removal; aggressive diuresis for the wedge pressure alone is the reductionist error | 15 |
| Systemic venous congestion | Filling pressures only mildly elevated; abnormal hepatic vein flow, pulsatile portal vein, intrarenal venous congestion, ascites, worsening renal function | Large-volume resuscitation into structurally normal chambers with preserved compliance: the heart tolerates the volume, the venous system and the abdominal organs do not | A "normal" wedge pressure does not imply the absence of harmful congestion; the organ-level assessment reveals the physiology | 15 |
| Global cardiorenal congestion | Elevated filling pressures, diffuse venous congestion, abnormal venous Doppler throughout the systemic circulation, multiorgan dysfunction | Advanced biventricular failure | Decongestion individualized to the mechanism; mechanical circulatory support among the options when forward flow fails | 15 |
| Isolated right-sided failure | Markedly elevated central venous pressure with a low or normal wedge pressure; hepatic vein patterns abnormal by default; IVC dilatation chronic rather than diagnostic | Pulmonary hypertension, severe tricuspid regurgitation or advanced RV dysfunction, in which venous hypertension coexists with preload dependence | Excessive decongestion can reduce RV filling to a catastrophic fall in forward output; preload preservation | 15 |
The four windows have also been packaged into one number, the venous excess ultrasound score, to test whether the combination predicts organ injury better than any component alone. The score takes a dilated IVC as its entry criterion and then counts the beds in which the pressure finding is marked (Table 8.5): with an IVC of 2 cm or more, transmitted findings only, marked findings in one bed, or marked findings in at least two of the three beds.16,17,19 Its IVC measurement differs from the ASE's. The derivation cohort took the maximal diameter across the respiratory cycle in the intra-hepatic portion 2 cm from the hepatic vein junction,16 whereas the ASE measures at end-expiration 0.5 to 3.0 cm proximal to the right atrial ostium,13 a different site in a different phase of respiration, and potentially a different answer in one patient. The report should therefore say which convention the number came from. That ASE site is the book's house measurement, and section 6.4 sets it out together with the IVC-to-RAP algorithm built on it. This book does not use the number as a grade: what matters at the bedside is the physiology the windows report, read in context.15
Таблиця 8.5. Transmitted and marked pressure findings in each venous bed, as the research literature defines them
| Bed | Transmitted (the literature's "mild") | Marked (the literature's "severe") | Source |
|---|---|---|---|
| Hepatic vein | Systolic phase smaller than diastolic but still away from the liver | Reversed systolic phase | 16 |
| Portal vein | Pulsatility fraction 30–49% | Pulsatility fraction >50% | 16 |
| Intrarenal vein | Discontinuous, systolic and diastolic phases | Discontinuous, diastolic phase only | 16 |
The score's derivation and its tests remain worth knowing, because they measure what a packaged number can and cannot do. The derivation was a post hoc analysis of a single-center cohort of 145 non-critically-ill cardiac surgery patients, 706 assessments over 72 postoperative hours, 49 (33.8%) developing AKI by KDIGO criteria, excluding cirrhosis, portal thrombosis, dialysis and preoperative critical illness. Of five prototypes, the one requiring marked abnormalities in multiple beds with a dilated IVC associated most strongly with subsequent AKI (hazard ratio 3.69, and 2.82 adjusted for baseline risk and vasopressor-inotrope score). At ICU admission, marked findings in at least two beds had 96% specificity but 27% sensitivity and a positive likelihood ratio of 6.37 (95% CI 2.19–18.50) that no CVP cutoff or single marker matched, while IVC dilatation alone had 41% specificity, the figure quoted against the caval sign in section 8.6. The authors' own conclusion is the fulcrum of this section: "we cannot definitely confirm based on the available data the superiority of the VExUS C grading system compared to the other candidate classifications or compared to individual findings".16
What the combined assessment has and has not been shown to do
Table 8.6 collects the evidence published since the derivation, cohort by cohort.
Таблиця 8.6. What the later cohorts show for the combined assessment, cohort by cohort
| What the later evidence shows | Source |
|---|---|
| 56 examinations before catheterization: area under the curve 0.99 for RAP ≥12 mm Hg against 0.79 for IVC diameter, but none ventilated or on vasoactives | 70 |
| 81 patients: marked findings in one bed, and in two or more, associated with RAP (beta 4.8 and 11); area 0.9 for RAP >10 mm Hg against 0.77 for IVC diameter | 18 |
| 95 patients, same center, again none ventilated or on vasoactives: area 0.87; omitting the renal vein performed equivalently (0.85, kappa 0.85), and each component alone matched the combined assessment (0.81, 0.86, 0.9) against 0.71 for the 2-cm IVC | 71 |
| 145 general ICU patients: marked findings in one bed in 16%, in two or more beds in 6%; the admission assessment associated with neither AKI (p = 0.136) nor 28-day mortality (p = 0.594) | 72 |
| 138 ICU patients: marked findings in one bed in 8%, in two or more in 4%; marked findings in at least one bed associated with major adverse kidney events at 30 days (odds ratio 4.3) | 73 |
| 125 patients with KDIGO stage ≥2 AKI, 291 assessments: individual markers not associated with major adverse kidney events at 30 days, but a marked portal, hepatic or intrarenal vein abnormality was each independently associated with mortality, as was the combined assessment (one marked bed, adjusted hazard ratio 4.03, 95% CI 1.81–8.99; two or more, 2.70, 1.10–6.65) | 74 |
| Nine studies, 1,036 patients: marked findings in at least one bed associated with AKI (odds ratio 2.63, I2 = 74%), stronger in cardiac surgery (3.86), not with mortality (1.25) | 75 |
| Review of the original research: prognostic in cardiological settings, inconsistent elsewhere, little evidence for guiding management, redundant with single-site indices | 76 |
| Reliability across four attendings of different specialties: kappa 0.71, intraclass correlation 0.83, better with a concurrent electrocardiogram | 54 |
| Handheld against conventional equipment: overall agreement kappa above 0.85 in half the time, but renal vein concordance kappa 0.55 against 0.653 | 53 |
Two patterns run through the table. The combined assessment tracks RAP well in cardiology populations who are neither ventilated nor on vasoactive drugs, and in the one study that took the components apart each Doppler component performed as well as the whole. The admission assessment was associated with neither AKI nor 28-day mortality in 145 general ICU patients,72 and across nine studies the pooled odds ratio for AKI was 2.63, driven by the cardiac surgery cohorts and absent for mortality.75 Outside cardiac surgery its association with organ injury is inconsistent. The decisive gap is interventional and it is an absence of evidence, because no randomized trial of venous-Doppler-guided decongestion in ICU patients has been reported. In a single-center trial of 140 patients with cardiorenal syndrome type 1, guiding decongestion by the combined venous assessment did not improve kidney function recovery, its primary endpoint, but more than doubled the odds of achieving decongestion (2.6) and of a fall in B-type natriuretic peptide greater than 30% (2.4).77 A multicenter trial randomized 388 patients with acute decompensated heart failure to decongestion guided by daily IVC ultrasound added to clinical assessment or by clinical assessment alone. Among the 327 analyzed for the primary endpoint the between-group difference in the change in N-terminal pro-B-type natriuretic peptide to discharge was 5.4% (95% CI -9.4% to 22.6%, p = 0.58), and the authors concluded that adding IVC evaluation did not improve decongestion.78 The score's authors state its scope plainly. It will not tell you whether the patient needs fluid, but it may provide stop points to resuscitation and identify patients likely to tolerate and benefit from fluid removal.17 It distinguishes neither volume from pressure overload, nor tolerance from responsiveness,19 so it replaces none of the dynamic tests of sections 8.3 and 8.4 and answers only the second of the chapter's two questions.
8.11 Deciding: tolerance, decongestion and when the right ventricle is the cause
T2F A congestive finding supports one of three conclusions, a stop point, a decongestion target or nothing, to be named before the probe is put down.
A congestive finding supports one of only three conclusions, and naming which one is intended before the probe is put down is what keeps a finding from becoming a reflex.
The first is a stop point. The patient who is still preload responsive and congested at the same time is the one in whom the test of section 8.3 must not be obeyed. In the published example a postpartum patient in refractory shock, whose monitor showed a stroke volume variation of 23%, received more than 6 L of fluid as "volume responsive" while POCUS showed a dilated IVC, a retrograde hepatic vein systolic wave, a 100% pulsatile portal vein, a dilated right ventricle with a D-shaped septum and severe tricuspid regurgitation (TR). Ultrafiltration of 5 L within 24 hours improved the septal shift, the lactate and the vasopressor requirement.17
The second is a decongestion target, which turns the waveform from a diagnosis into a monitor. In the same series, in one patient portal pulsatility fell from 100% to about 30% as ascites was drained and diuresis restarted, and creatinine returned to normal. In another it fell from 65% to 35% and then 20% while the hepatic vein returned from systolic reversal to a systolic wave larger than the diastolic one, intrarenal flow moved from discontinuous monophasic to biphasic, and creatinine followed.17 Whether congestion predicts diuretic efficiency is unsettled: in 43 patients with acute decompensated heart failure and AKI, urine output per 40 mg of furosemide fell as the venous findings worsened, 270 ± 167 mL with marked findings in two or more beds against 507 ± 189 mL with none or transmitted findings only, independently of admission creatinine.79 The counterweight belongs beside it, because in 77 cardiovascular ICU patients given loop diuretics, the venous findings were associated with neither worsening renal function (20.0% versus 37.8%, p = 0.139) nor any diuretic response parameter.80 Serial use also needs the discipline of section 8.2, where a change counts only once it exceeds the LSC of the measurement being repeated, and for the IVC collapsibility index a change greater than 10% is meaningful.14 No LSC has been published for the hepatic venous systolic filling fraction or the portal pulsatility fraction, so serial comparison of either rests on judgment, with no number to anchor it.
When the finding changes nothing, and when the right ventricle is the cause
The third conclusion is that the finding changes nothing, by either of two routes. One is a confounded signal, from raised intra-abdominal pressure compressing the IVC, a remodeled IVC in chronic pulmonary hypertension, severe TR, cirrhosis or steatosis damping the portal vein, parenchymal renal disease, atrial fibrillation abolishing the hepatic A wave, a recent PEEP change, or mechanical support, where hepatic vein flow reversal already forms part of the left ventricular assist device low-flow alarm algorithm of Chapter 13. A venous finding is not by itself an indication to remove fluid;19 the questions are where pressure is being transmitted, how the organs are responding, whether venous capacitance has been exhausted, whether the congestion is maladaptive and whether forward flow remains adequate.15 The other is the absence of anything to decongest toward, because cardiac output may depend on high preload in long-standing pulmonary hypertension, and where the venous findings arise from a pericardial effusion, removing volume may precipitate tamponade.19 The case for restraint is nonetheless strong. Mean fluid balance independently predicted 60-day mortality in the SOAP cohort's 1,120 patients with acute renal failure,81 and across 11 randomized trials a conservative or deresuscitative strategy left mortality unchanged (risk ratio 0.92) while adding 1.82 ventilator-free days and shortening ICU stay by 1.88 days.82
Ask last whether the right ventricle is the cause, because that changes the treatment as well as the target. In acute respiratory distress syndrome, hypoxic vasoconstriction, hypercapnia, acidosis and thrombosis raise right ventricular afterload, mechanical ventilation can aggravate the disturbance, renal dysfunction follows from impaired perfusion and venous congestion, and volume overload feeds a cycle of septal bowing, reduced left ventricular preload and circulatory failure, with PEEP titration critical and no pharmacological treatment specifically approved.83 The invasive analog is the pulmonary artery pulsatility index, which in acute inferior myocardial infarction was far lower with suspected severe right ventricular dysfunction than in non-obstructive coronary disease or acute coronary syndrome controls (1.11 ± 0.57 versus 4.32 ± 3.04 and 5.52 ± 4.40); a value of 0.9 or less gave 100.0% sensitivity and 98.3% specificity for in-hospital death or a percutaneous right ventricular support device.84 Right ventricular failure itself is the subject of Chapter 6, which also carries the caval and hepatic readings of RAP that this chapter borrows.
Reporting an abdominal venous study, and what a supervisor checks before signing
F Reporting closes the study. Estimated RAP is recommended to be reported, even as "unable to assess", and abnormal hepatic vein waveform observations reported when warranted, volume status being one of the ASE's named examples;21 the noninvasive methods available comprise indices from the IVC, the systemic and hepatic veins, tissue Doppler parameters and right atrial dimensions, and every one of them is indirect.85 The abdominal component falls outside the cardiac examination and is reported accordingly, named as a cardiac POCUS examination with an examination of the other system and archived so the noncardiac elements are clearly identified.20 A supervisor checks four things before signing: that the waveform phases were assigned against a simultaneous electrocardiogram, that the fractions were calculated from measured velocities, that the bed-specific confounders were named, and that the note says what the finding changes, or that it changes nothing.
8.12 What the guidelines recommend, and whether guiding fluid by echocardiography changes outcome
T1 Both halves of the chapter have been turned into strategies and tested, and the trial evidence is thinner than the physiology behind it. The Surviving Sepsis Campaign 2021 suggests using dynamic measures to guide fluid resuscitation in adults with sepsis or septic shock, over physical examination or static parameters alone; this is a weak recommendation on very low-quality evidence, and its remark defines dynamic parameters as the response to a passive leg raise or a fluid bolus using stroke volume, stroke volume variation, pulse pressure variation, or echocardiography where available. It sits alongside the weak, low-quality recommendation for at least 30 mL/kg of crystalloid within the first three hours. The guideline also states that heart rate, CVP and systolic blood pressure alone are poor indicators of fluid status, that dynamic measures have better diagnostic accuracy than static techniques, and that where cardiac output cannot be measured a pulse pressure rise of more than 15% during a 60 to 90 second passive leg raise can indicate responsiveness.22 The 2026 campaign guideline, 129 statements of which 46 are new, from a 69-member panel drawn from 23 countries, keeps the recommendation and regrades it as conditional on low certainty evidence, its remark now reading that "Dynamic measures include response to a passive leg raise or a fluid bolus using stroke volume (SV), stroke volume variation (SVV), pulse pressure (PP), or pulse pressure variation (PPV)"; it suggests serial lactate measurements and capillary refill time as adjuncts to guide resuscitation (both conditional, low certainty), suggests at least 30 mL/kg of crystalloid in the first 3 hours for sepsis-induced hypoperfusion or septic shock (conditional, low certainty) with frequent reassessment to avoid under- or over-resuscitation, and finds insufficient evidence to make a recommendation on minimally invasive or noninvasive cardiac output monitoring in addition to usual care.86 That last statement's remark adds that "The use of critical care ultrasound was not evaluated", and the rationale behind the dynamic-measures recommendation states that "Increases of 10–15% in the chosen parameter (e.g., stroke volume) following a fluid challenge or passive leg raise maneuver are reflective of fluid-responsiveness", that in a meta-analysis of all 18 randomized trials done for the guideline, fluid management guided by dynamic measures "likely reduces mortality" (RR 0.91, 95% CI 0.79–1.06, moderate certainty) and "likely results in a large reduction in need for" renal replacement therapy (RR 0.75, 95% CI 0.58–0.98), that "measurements of inferior vena cava diameter or collapsibility principally reflect central venous pressure (CVP) and are subject to the same limitations as CVP measurement", that a systematic review it cites found POCUS-guided resuscitation "probably reduces 28-day mortality (RR 0.88; 95% CI, 0.78–0.99)", and that dynamic echocardiographic estimation of SV "requires technical expertise and experience that may not be readily available in low resource settings".86 Society of Critical Care Medicine guidance grades cardiac ultrasonography to assess preload responsiveness in mechanically ventilated patients as a strong recommendation on moderate-quality evidence (1B), and its use to assess the efficacy of fluid resuscitation as 1C.87
The trial most often invoked is FRESH. Adults at 13 hospitals in the United States and United Kingdom with sepsis-associated hypotension (mean arterial pressure at or below 65 mm Hg after 1 to 3 L of fluid) and anticipated ICU admission were randomized 2:1 to PLR-guided stroke volume assessment before every fluid bolus or vasopressor escalation for 72 hours, or to usual care. In the modified intention-to-treat population of 124 patients (83 intervention, 41 usual care), fluid balance at 72 hours or ICU discharge was 0.65 ± 2.85 L versus 2.02 ± 3.44 L, a difference of -1.37 L favoring the intervention (p = 0.021); fewer required renal replacement therapy (5.1% versus 17.5%, p = 0.04) or mechanical ventilation (17.7% versus 34.1%, p = 0.04); 30-day mortality did not differ (15.7% versus 22.0%) and serious adverse events were similar. Two details matter for an echocardiographer. Stroke volume was measured by noninvasive bioreactance, so the trial did not use echocardiography at all, and a rise of 10% or more defined responsiveness. Responsiveness was also not a fixed patient property, since across 523 PLRs in 83 patients (median 5 per patient) only 42.2% of patients were responsive on the first test, 81.9% at least once over 72 hours, 12.0% persistently and 18.1% never.23 That distribution is the practical case for repeating the test, since one test on admission does not settle the question.
Across the wider evidence the effect is consistent but modest. Perioperatively, meta-analyses of strategies guided by preload responsiveness show reductions in mortality, ICU length of stay and postoperative complications. In non-surgical ICU patients only three randomized trials had been published in English by the 2022 review, all in early septic shock and all using PLR, two achieving their primary goal of reducing administered fluid, the largest also showing reduced need for renal replacement therapy and mechanical ventilation, and none showing a mortality benefit in meta-analysis. The argument for using these tests anyway is that they are harmless, use monitoring recommended in shock in any case, and restrict a potentially dangerous drug to patients who might benefit.2
Two applications are easy to forget. Testing responsiveness also guides de-escalation, because without responsiveness fluid can usually be removed without lowering cardiac output, and a PLR performed before starting fluid removal predicted intradialytic hypotension with good specificity and positive predictive value.1,2 After a bolus the response must also be verified, since no test is perfect and a persisting responsive state raises the question of another bolus; the endpoint is tissue perfusion, judged by mottling, capillary refill time, lactate, venous oxygen saturation and carbon dioxide-derived indices.2,22
Key points
-
Fluid raises cardiac output in only about half of patients when responsiveness is not tested and no static index predicts who will respond, so a positive test licenses fluid only when circulatory failure is present and the risk of overload is acceptable, while a negative test should stop fluid.1,24,28
-
PLR survives spontaneous breathing, arrhythmia, low tidal volume and low compliance, with pooled sensitivity 0.85 and specificity 0.91 at a cardiac output threshold of 10 ± 2%.1,11,28
-
PLR must start semi-recumbent, be produced by moving the bed, be read on cardiac output within one minute, be followed by a return-to-baseline measurement, and be protected from adrenergic stimulation.28,32
-
Judged by LVOT VTI, the ASE threshold for PLR is an increase of more than 12.5%, giving 77% sensitivity and 100% specificity.14
-
The least significant change of LVOT VTI between examinations is 11% for one operator and 14% for two, so a test with a 4 to 6% threshold must be modified before echocardiography can assess it.2,33 Either combine the end-expiratory and end-inspiratory holds and sum the absolute VTI changes (threshold 13 to 15%), or use a 100 mL mini-fluid challenge read at a 10% rise in subaortic VTI.1,2,8,33
-
The end-expiratory occlusion test uses a hold of at least 15 seconds and a 5% cardiac output threshold; by echocardiography, combine it with an end-inspiratory hold and sum the absolute VTI changes, threshold 13 to 15%.1,2
-
A mini-fluid challenge of 100 mL over one minute predicts the response to a further 400 mL when subaortic VTI rises by 10% or more (95% sensitivity, 78% specificity).8
-
In 540 ventilated patients, LVOT peak velocity variation of 10% or more had the best sensitivity (79%) and SVC collapsibility of 21% or more the best specificity (84%), with SVC measurable in 99.6% versus 78.1% for IVC.9
-
Meta-analysis of the caval index gives a pooled area under the curve of 0.71 with extreme heterogeneity; the IVC should not be the primary test of fluid responsiveness.2,10
-
On positive-pressure ventilation IVC collapse cannot estimate RAP, so the caval measurement made in this chapter is a statement about preload responsiveness and fluid tolerance and nothing more; the pressure conversion, and the little of it that survives the ventilator, belong to section 6.4.12,13
-
A plethoric IVC alone had only 41% specificity for congestive acute kidney injury, so caval caliber must not be read as venous congestion; the venous Doppler beds, and what they add up to, are developed in sections 8.7 to 8.10.16
-
Surviving Sepsis 2021 suggests dynamic measures over physical examination or static parameters alone (weak recommendation, very low-quality evidence), the 2026 update keeps the recommendation as conditional on low certainty evidence,86 and PLR-guided resuscitation in FRESH cut 72-hour fluid balance by 1.37 L with less renal replacement therapy and mechanical ventilation, without a mortality difference.22,23
-
True organ perfusion pressure is precapillary arteriolar minus postcapillary venular pressure, with an inflow term of 35–40 mm Hg where the usual expression uses a mean arterial pressure above 90, so a rise in venous pressure narrows the gradient by more than an equal fall in arterial pressure does.17
-
About 70% of blood volume sits in veins some 30 times more compliant than arteries, so one central venous pressure cannot report volume and means little without a measure of cardiac output.26,30
-
Normal portal vein pulsatility fraction, (Vmax - Vmin)/Vmax, is below 30% and 50% or more is severe; raising PEEP from 0 to 15 cm H2O alone moved it from 9% to 45%.19,47
-
Intrarenal venous flow patterns map onto pressure, with mean right atrial pressure 5.4 ± 2.5 mm Hg for the continuous pattern, 9.5 ± 3.5 for the biphasic and 14.9 ± 4.3 for the monophasic.49,88
-
Elevated central venous pressure tracks acute kidney injury and death, from 18 ± 7 versus 12 ± 6 mm Hg on admission in decompensated heart failure to a 2% higher adjusted risk of acute kidney injury per 1 cm H2O (95% CI 1.00 to 1.03, p = 0.02) among the 4,761 patients with an admission central venous pressure recorded within a 12,778-patient critical illness cohort, yet no threshold for intervention is established.59,62,63
-
Marked findings in at least two of the three beds had 96% specificity but 27% sensitivity for acute kidney injury after cardiac surgery, so their absence excludes nothing. Outside cardiac surgery the signal is inconsistent, with no association with injury or mortality in 145 general ICU patients, no association between the individual markers and major adverse kidney events at 30 days in 125 patients with established injury, although in that cohort each severely abnormal portal, hepatic and intrarenal vein Doppler was independently associated with mortality, and a pooled odds ratio of 2.63 driven by the cardiac surgery cohorts.16,72,74,75
-
No randomized trial of venous-Doppler-guided decongestion in ICU patients was found; one single-center trial in cardiorenal syndrome type 1 improved decongestion but not kidney function recovery, and one multicenter trial that added IVC ultrasound to clinical assessment showed no benefit over clinical assessment alone.77,78
Pitfalls and pearls
-
Reading PLR from the arterial line alone sharply reduces its sensitivity, which falls from a pooled 0.85 with cardiac output to 0.56 with pulse pressure, so read it on a direct measure of cardiac output.11
-
Lifting the legs by hand flexes the hip, compresses the femoral vein and mobilizes only abdominal blood, underestimating the response, so tilt the bed instead. A heart rate rise during PLR usually signals pain, cough or awakening, so the accompanying cardiac output change is an artifact and does not reflect preload recruitment.28,32
-
Putting the probe down between baseline and test is the largest single source of error in an echocardiographic dynamic test; keep the beam in the LVOT.2
-
A plethoric IVC does not by itself mean congestion, since alone it had 41% specificity for congestive acute kidney injury, and it may be normal in athletes, young adults and pregnancy.13,16
-
The two landmark IVC thresholds are not interchangeable, because the 18% distensibility index is normalized to the minimum diameter and the 12% respiratory variation index was derived separately in its own cohort, which is part of why published thresholds span 12% to 40%.1,5,6
-
M-mode exaggerates collapse when the vessel translates out of plane; confirm on 2D and measure at a fixed distance from the right atrium, away from the hepatic vein confluence and the diaphragm.14,32
-
A small end-systolic left ventricular dimension alone may mean low systemic vascular resistance or high inotropy, whereas hypovolemia reduces the end-diastolic dimension as well.14
-
Responsiveness is not a fixed property. Across 523 PLRs, only 42.2% were responsive on the first test but 81.9% at least once over 72 hours, the practical case for repeating the test before each decision.23
-
Supervisors should confirm the trainee obtained the LVOT signal at the same site and respiratory phase before and after the maneuver, and that a return-to-baseline measurement exists, before accepting a PLR result.28,32
-
A non-pulsatile portal vein does not exclude congestion, because in cirrhosis or steatosis stiff parenchyma damps sinusoidal transmission, and the vessel may instead show low-velocity continuous or hepatofugal flow.17,19
-
Record the ventilator settings and the posture with every venous trace, because the two interventional studies disagree over which of PEEP and position moves these waveforms, and PLR is itself one of the manipulations at issue.47,48
-
Reject an inadequate intrarenal trace instead of interpreting it, since the signal counts only when arterial flow above and venous flow below the baseline are visible for two or more cycles, and this component has the lowest agreement between readers.17,53
-
Handheld devices read the venous beds comparably and halve scanning time but typically lack the electrocardiogram channel on which correct phase assignment depends.19,53
-
The IVC of the congestion studies is measured at a different site and in a different respiratory phase from the right-atrial-pressure IVC of section 6.4, so state which convention was used.13,16
-
Draining ascites does not decongest the venous system, and in the published case 12 L of drainage normalized intra-abdominal pressure clinically yet portal pulsatility persisted until diuresis was escalated.17
-
Supervisors should refuse to sign a venous congestion study in which the phases were not assigned against an electrocardiogram, the fractions were estimated by eye with no velocities measured, or the note omits what the finding changes.19,21
Bedside self-assessment checklist
| Domain | Item | Standard to meet | Source |
|---|---|---|---|
| Indication | I stated the clinical question before scanning: is this patient preload responsive, congested, or both | Question named in the note; study labeled FoCUS or advanced CCE | 14, 89 |
| Indication | I confirmed acute circulatory failure is present before testing responsiveness | Hypotension, low cardiac output or tissue hypoperfusion documented; no test in a stable patient | 1, 2 |
| Indication | I checked whether the answer is already obvious and testing would only delay treatment | Hemorrhage, overt hypovolemia or first-phase septic shock before any volume: give fluid, do not test | 1, 2 |
| Indication | I recorded ventilation mode, tidal volume, PEEP, spontaneous effort, rhythm and intra-abdominal pressure concerns before choosing an index | Documented, because these determine which index is valid | 1, 2 |
| Indication | I checked contraindications to the test selected | No PLR in intracranial hypertension; no occlusion test in a non-intubated patient or one who breaks the hold | 1, 2 |
| Indication | I asked the tolerance question separately from the responsiveness question | Congestion, oxygenation and organ risk weighed before any bolus is given | 17, 24 |
| Indication | I asked whether the right ventricle is the cause of the congestion | Right ventricular size, function and afterload assessed; pericardial constraint excluded | 19, 83 |
| Indication | I checked whether this patient falls in a category in which one of the venous signals is uninterpretable | Cirrhosis or steatosis for the portal vein, parenchymal renal disease for the intrarenal veins, severe tricuspid regurgitation for the hepatic vein, raised intra-abdominal pressure for the IVC, atrial fibrillation for phase assignment | 17, 19 |
| Indication | I declared an abdominal venous study under the ASE nomenclature as a cardiac examination with an examination of another system, and archived it so the noncardiac elements are identified | Named as cardiac POCUS with abdominal venous Doppler, not as a cardiac study | 20 |
| Acquisition | I obtained an LVOT pulsed-wave signal with the closing click visible, low wall filter and gain set to the modal envelope | 5 to 7 mm gate in the LVOT; outer edge of modal velocity traced | 32 |
| Acquisition | I averaged an adequate number of beats | Three in sinus rhythm, five in atrial fibrillation within one examination; five to seven consecutive beats when arrhythmia is present during PLR | 32, 33 |
| Acquisition | I kept the probe on the chest and the sample volume in the same LVOT position throughout the maneuver | No re-acquisition of the window between baseline and test | 2 |
| Acquisition | I performed PLR by moving the bed from semi-recumbent to trunk horizontal with legs at 30 to 45 degrees | Trunk-to-leg angle unchanged; legs not lifted by hand; secretions suctioned and awake patient informed first | 28, 32 |
| Acquisition | I measured the PLR effect within about one minute and again after returning the patient to semi-recumbent | Three paired VTI values recorded: baseline, PLR, return | 28, 32 |
| Acquisition | I imaged the IVC in a subcostal long axis, perpendicular to its long axis, at the site the book measures to | The house measurement of section 6.4, which is 0.5 to 3.0 cm proximal to the RA ostium read at end-expiration; the 1.0 to 2.0 cm from the junction quoted from the 2015 guideline falls inside it; away from the hepatic vein confluence and diaphragm | 12, 13, 32 |
| Acquisition | I confirmed on 2D that apparent IVC collapse is narrowing and not translation out of plane | Pseudocollapse excluded before any number is reported | 13, 14 |
| Acquisition | Where the transthoracic answer was equivocal in a ventilated patient, I considered TEE for SVC collapsibility | SVC measurable in 99.6% of ventilated patients versus 78.1% for IVC | 9 |
| Acquisition | I acquired the hepatic vein trace to the standard of section 6.4, with a simultaneous electrocardiogram running so the phases could be assigned | Subcostal, 3 to 4 mm sample volume, gate 1 to 2 cm from the IVC junction, at least five consecutive beats spanning one respiratory cycle when ventilated; ECG channel present on the archived image, since reader agreement is higher with it | 13, 54 |
| Acquisition | I set the portal velocity scale and the angle so that both peak and trough velocities were on screen and measurable | Cardiac preset scale reduced from a default near 100 cm/s to about 40 cm/s; sweep 50 or 66.7 mm/s; no aliasing and no falsely absent flow | 19 |
| Acquisition | I obtained an intrarenal trace with arterial flow above and venous flow below the baseline for at least two cycles, and rejected an ambiguous study instead of interpreting it | Abdominal or trauma preset, Nyquist limit below 20 cm/s, color gain increased; inadequate trace recorded as uninterpretable | 17, 19 |
| Acquisition | For a venous congestion study I measured the IVC at the site the convention specifies, and said which convention I used | Congestion studies: intra-hepatic portion, 2 cm from the hepatic vein junction, maximal diameter across the respiratory cycle. Right atrial pressure: end-expiration, 0.5 to 3.0 cm proximal to the right atrial ostium, the house measurement of section 6.4 | 13, 16 |
| Interpretation | I applied the threshold belonging to the measurement I actually made | PLR: cardiac output rise 10 ± 2%, or LVOT VTI rise >12.5%; never a pulse pressure threshold applied to VTI | 11, 14 |
| Interpretation | I compared the observed change with the least significant change of my own measurement | LVOT VTI LSC 11% same operator, 14% between operators; ASE calls >6% meaningful | 14, 33 |
| Interpretation | I did not report an IVC index as a fluid-responsiveness test with spontaneous effort, low tidal volume, low compliance, intra-abdominal hypertension or right ventricular failure | Index withheld or explicitly flagged as uninterpretable | 2, 32 |
| Interpretation | I did not estimate RAP from IVC collapse on positive-pressure ventilation | Reported collapse as uninterpretable; used IVC ≤2.1 cm to identify RAP below 10 mm Hg, hepatic vein velocities over at least five beats, or a transduced invasive pressure | 12, 13 |
| Interpretation | I confirmed return to baseline before calling a PLR positive | Cardiac output returned to the pre-test value in the semi-recumbent position | 28 |
| Interpretation | I computed the portal pulsatility fraction from measured velocities | (Vmax - Vmin)/Vmax; below 30% normal, 30% to 50% a transmitted pulse, 50% or more marked | 19 |
| Interpretation | I named the false positive and the false negative for each venous bed before accepting it | Portal: lean or athletic subjects and arteriovenous connections as false positives, cirrhosis or steatosis as false negative. Hepatic: severe tricuspid regurgitation and atrial fibrillation as false positives, preserved right atrial compliance as false negative | 16, 17, 19 |
| Interpretation | I read the venous beds as pressure transmitted into the organs, in context, and did not read a plethoric IVC as congestion on its own | Dilatation alone has 41% specificity for congestive acute kidney injury and can be normal in athletes, young adults and pregnancy; marked findings in at least two beds are 96% specific and 27% sensitive for subsequent injury after cardiac surgery | 16 |
| Medical decision-making | I gave fluid only when circulatory failure, preload responsiveness and acceptable overload risk coexisted | All three documented; otherwise fluid withheld | 24, 28 |
| Medical decision-making | When the test was negative I named the alternative intervention | Vasopressor, inotrope, PEEP reduction or decongestion chosen instead of a bolus | 2, 28 |
| Medical decision-making | I verified the effect of any bolus given, without assuming it worked | Post-bolus stroke distance and perfusion markers (mottling, capillary refill time, lactate, venous oxygen saturation) rechecked | 2, 22 |
| Medical decision-making | I repeated the test before the next fluid decision, without relying on an earlier result | In FRESH only 42.2% were responsive on the first test but 81.9% at some point over 72 hours | 23 |
| Medical decision-making | I assessed preload responsiveness before starting fluid removal or ultrafiltration | Absence of responsiveness supports safe removal; a PLR before removal predicts intradialytic hypotension | 1, 2 |
| Medical decision-making | I documented the index used, its threshold, the measurement technique and the ventilatory and rhythm conditions at the time | Report allows the next operator to repeat the identical measurement; quantitative monitoring requires level II training, level III for Doppler hemodynamics | 14 |
| Medical decision-making | I said what the venous finding changes, or that it changes nothing, and recorded the standing of the evidence behind it | One of stop point, decongestion target, or nothing, written in the note, with the association to organ injury described as observational, strongest after cardiac surgery, and with no randomized trial of an ICU strategy guided by these signals | 17, 75, 76 |
| Medical decision-making | I did not treat a venous finding as an indication for fluid removal in the absence of a clinical decongestion target | No diuresis or ultrafiltration ordered on a venous finding alone; caution documented where cardiac output may depend on high preload | 19 |
| Medical decision-making | I named the waveform that must change, and by how much, before the next assessment counts as different | Target stated; no published least significant change exists for the hepatic venous systolic filling fraction or the portal pulsatility fraction, and a change greater than 10% is the rule quoted for the IVC collapsibility index | 14 |
| Medical decision-making | I reported the estimated right atrial pressure and, where warranted, the hepatic vein waveform | Right atrial pressure reported, even as "unable to assess"; hepatic vein waveform reported for volume status among other indications | 21 |
References
1. Monnet X, Marik PE, Teboul JL. Prediction of fluid responsiveness: an update. Ann Intensive Care. 2016;6(1):111. doi:10.1186/s13613-016-0216-7
2. Monnet X, Shi R, Teboul JL. Prediction of fluid responsiveness. What's new? Ann Intensive Care. 2022;12(1):46. doi:10.1186/s13613-022-01022-8
3. Monnet X, Rienzo M, Osman D, et al. Passive leg raising predicts fluid responsiveness in the critically ill. Crit Care Med. 2006;34(5):1402-7. doi:10.1097/01.CCM.0000215453.11735.06
4. Feissel M, Michard F, Mangin I, Ruyer O, Faller JP, Teboul JL. Respiratory changes in aortic blood velocity as an indicator of fluid responsiveness in ventilated patients with septic shock. Chest. 2001;119(3):867-73. doi:10.1378/chest.119.3.867
5. Barbier C, Loubières Y, Schmit C, et al. Respiratory changes in inferior vena cava diameter are helpful in predicting fluid responsiveness in ventilated septic patients. Intensive Care Med. 2004;30(9):1740-6. doi:10.1007/s00134-004-2259-8
6. Feissel M, Michard F, Faller JP, Teboul JL. The respiratory variation in inferior vena cava diameter as a guide to fluid therapy. Intensive Care Med. 2004;30(9):1834-7. doi:10.1007/s00134-004-2233-5
7. Vieillard-Baron A, Chergui K, Rabiller A, et al. Superior vena caval collapsibility as a gauge of volume status in ventilated septic patients. Intensive Care Med. 2004;30(9):1734-9. doi:10.1007/s00134-004-2361-y
8. Muller L, Toumi M, Bousquet PJ, et al. An increase in aortic blood flow after an infusion of 100 ml colloid over 1 minute can predict fluid responsiveness: the mini-fluid challenge study. Anesthesiology. 2011;115(3):541-7. doi:10.1097/ALN.0b013e318229a500
9. Vignon P, Repessé X, Bégot E, et al. Comparison of Echocardiographic Indices Used to Predict Fluid Responsiveness in Ventilated Patients. Am J Respir Crit Care Med. 2017;195(8):1022-1032. doi:10.1164/rccm.201604-0844OC
10. Orso D, Paoli I, Piani T, Cilenti FL, Cristiani L, Guglielmo N. Accuracy of Ultrasonographic Measurements of Inferior Vena Cava to Determine Fluid Responsiveness: A Systematic Review and Meta-Analysis. J Intensive Care Med. 2020;35(4):354-363. doi:10.1177/0885066617752308
11. Monnet X, Marik P, Teboul JL. Passive leg raising for predicting fluid responsiveness: a systematic review and meta-analysis. Intensive Care Med. 2016;42(12):1935-1947. doi:10.1007/s00134-015-4134-1
12. Lang RM, Badano LP, Mor-Avi V, et al. Recommendations for Cardiac Chamber Quantification by Echocardiography in Adults: An Update from the American Society of Echocardiography and the European Association of Cardiovascular Imaging. J Am Soc Echocardiogr. 2015;28:1-39.e14. doi:10.1016/j.echo.2014.10.003
13. Mukherjee M, Rudski LG, Addetia K, et al. Guidelines for the Echocardiographic Assessment of the Right Heart in Adults and Special Considerations in Pulmonary Hypertension: Recommendations from the American Society of Echocardiography. J Am Soc Echocardiogr. 2025;38:141-186. doi:10.1016/j.echo.2025.01.006
14. Porter TR, Shillcutt SK, Adams MS, et al. Guidelines for the Use of Echocardiography as a Monitor for Therapeutic Intervention in Adults: A Report from the American Society of Echocardiography. J Am Soc Echocardiogr. 2015;28:40-56. doi:10.1016/j.echo.2014.09.009
15. Senussi MH. The Problem With Volume Status. JACC Case Rep. 2026;31(41):109674. doi:10.1016/j.jaccas.2026.109674
16. Beaubien-Souligny W, Rola P, Haycock K, et al. Quantifying systemic congestion with Point-Of-Care ultrasound: development of the venous excess ultrasound grading system. Ultrasound J. 2020;12(1):16. doi:10.1186/s13089-020-00163-w
17. Rola P, Miralles-Aguiar F, Argaiz E, et al. Clinical applications of the venous excess ultrasound (VExUS) score: conceptual review and case series. Ultrasound J. 2021;13(1):32. doi:10.1186/s13089-021-00232-8
18. Longino A, Martin K, Leyba K, et al. Prospective Evaluation of Venous Excess Ultrasound for Estimation of Venous Congestion. Chest. 2024;165(3):590-600. doi:10.1016/j.chest.2023.09.029
19. Assavapokee T, Rola P, Assavapokee N, Koratala A. Decoding VExUS: a practical guide for excelling in point-of-care ultrasound assessment of venous congestion. Ultrasound J. 2024;16(1):48. doi:10.1186/s13089-024-00396-z
20. Kirkpatrick JN, Panebianco N, Díaz-Gómez JL, et al. Recommendations for Cardiac Point-of-Care Ultrasound Nomenclature. J Am Soc Echocardiogr. 2024;37:809-819. doi:10.1016/j.echo.2024.05.001
21. Taub CC, Stainback RF, Abraham T, et al. Guidelines for the Standardization of Adult Echocardiography Reporting: Recommendations From the American Society of Echocardiography. J Am Soc Echocardiogr. 2025;38:735-774. doi:10.1016/j.echo.2025.06.001
22. Evans L, Rhodes A, Alhazzani W, et al. Surviving Sepsis Campaign: International Guidelines for Management of Sepsis and Septic Shock 2021. Crit Care Med. 2021;49(11):e1063-e1143. doi:10.1097/CCM.0000000000005337
23. Douglas IS, Alapat PM, Corl KA, et al. Fluid Response Evaluation in Sepsis Hypotension and Shock: A Randomized Clinical Trial. Chest. 2020;158(4):1431-1445. doi:10.1016/j.chest.2020.04.025
24. Cecconi M, De Backer D, Antonelli M, et al. Consensus on circulatory shock and hemodynamic monitoring. Task force of the European Society of Intensive Care Medicine. Intensive Care Med. 2014;40(12):1795-815. doi:10.1007/s00134-014-3525-z
25. Osman D, Ridel C, Ray P, et al. Cardiac filling pressures are not appropriate to predict hemodynamic response to volume challenge. Crit Care Med. 2007;35(1):64-8. doi:10.1097/01.CCM.0000249851.94101.4F
26. Gelman S. Venous function and central venous pressure: a physiologic story. Anesthesiology. 2008;108(4):735-48. doi:10.1097/ALN.0b013e3181672607
27. Persichini R, Lai C, Teboul JL, Adda I, Guérin L, Monnet X. Venous return and mean systemic filling pressure: physiology and clinical applications. Crit Care. 2022;26(1):150. doi:10.1186/s13054-022-04024-x
28. Monnet X, Teboul JL. Passive leg raising: five rules, not a drop of fluid! Crit Care. 2015;19(1):18. doi:10.1186/s13054-014-0708-5
29. Magder S. Right Atrial Pressure in the Critically Ill: How to Measure, What Is the Value, What Are the Limitations? Chest. 2017;151(4):908-916. doi:10.1016/j.chest.2016.10.026
30. Magder S. Central venous pressure: A useful but not so simple measurement. Crit Care Med. 2006;34(8):2224-7. doi:10.1097/01.CCM.0000227646.98423.98
31. Nijst P, Martens P, Dupont M, Tang WHW, Mullens W. Intrarenal Flow Alterations During Transition From Euvolemia to Intravascular Volume Expansion in Heart Failure Patients. JACC Heart Fail. 2017;5(9):672-681. doi:10.1016/j.jchf.2017.05.006
32. Orde S, Slama M, Hilton A, Yastrebov K, McLean A. Pearls and pitfalls in comprehensive critical care echocardiography. Crit Care. 2017;21(1):279. doi:10.1186/s13054-017-1866-z
33. Jozwiak M, Mercado P, Teboul JL, et al. What is the lowest change in cardiac output that transthoracic echocardiography can detect? Crit Care. 2019;23(1):116. doi:10.1186/s13054-019-2413-x
34. Mercado P, Maizel J, Beyls C, et al. Transthoracic echocardiography: an accurate and precise method for estimating cardiac output in the critically ill patient. Crit Care. 2017;21(1):136. doi:10.1186/s13054-017-1737-7
35. Meco M, Giustiniano E, Nisi F, Zulli P, Agosteo E. Predicting Fluid Responsiveness in Mechanically Ventilated Adults: An Umbrella Review of Diagnostic Accuracy Meta-Analyses. Anesth Analg. 2026. doi:10.1213/ANE.0000000000008215
36. Mallat J, Siuba MT, Abou-Arab O, et al. Changes in pulse pressure variation induced by passive leg raising test to predict preload responsiveness in mechanically ventilated patients with low tidal volume in ICU: a systematic review and meta-analysis. Crit Care. 2025;29(1):18. doi:10.1186/s13054-024-05238-x
37. McLean AS. Echocardiography in shock management. Crit Care. 2016;20:275. doi:10.1186/s13054-016-1401-7
38. Hahn RT, Abraham T, Adams MS, et al. Guidelines for Performing a Comprehensive Transesophageal Echocardiographic Examination: Recommendations from the American Society of Echocardiography and the Society of Cardiovascular Anesthesiologists. J Am Soc Echocardiogr. 2013;26:921-964. doi:10.1016/j.echo.2013.07.009
39. Vieillard-Baron A, Evrard B, Repessé X, et al. Limited value of end-expiratory inferior vena cava diameter to predict fluid responsiveness impact of intra-abdominal pressure. Intensive Care Med. 2018;44(2):197-203. doi:10.1007/s00134-018-5067-2
40. Kattan E, Castro R, Miralles-Aguiar F, Hernández G, Rola P. The emerging concept of fluid tolerance: A position paper. J Crit Care. 2022;71:154070. doi:10.1016/j.jcrc.2022.154070
41. Argaiz ER, Rola P, Haycock KH, Verbrugge FH. Fluid management in acute kidney injury: from evaluating fluid responsiveness towards assessment of fluid tolerance. Eur Heart J Acute Cardiovasc Care. 2022;11(10):786-793. doi:10.1093/ehjacc/zuac104
42. Lichtenstein D. FALLS-protocol: lung ultrasound in hemodynamic assessment of shock. Heart Lung Vessel. 2013;5(3):142-7.
43. Eljaiek R, Cavayas YA, Rodrigue E, et al. High postoperative portal venous flow pulsatility indicates right ventricular dysfunction and predicts complications in cardiac surgery patients. Br J Anaesth. 2018;122(2):206-214. doi:10.1016/j.bja.2018.09.028
44. Beaubien-Souligny W, Benkreira A, Robillard P, et al. Alterations in Portal Vein Flow and Intrarenal Venous Flow Are Associated With Acute Kidney Injury After Cardiac Surgery: A Prospective Observational Cohort Study. J Am Heart Assoc. 2018;7(19):e009961. doi:10.1161/JAHA.118.009961
45. Koratala A, Romero-González G, Soliman-Aboumarie H, Kazory A. Unlocking the Potential of VExUS in Assessing Venous Congestion: The Art of Doing It Right. Cardiorenal Med. 2024;14(1):350-374. doi:10.1159/000539469
46. Barakat M. Portal vein pulsatility and spectral width changes in patients with portal hypertension: relation to the severity of liver disease. Br J Radiol. 2002;75(893):417-21. doi:10.1259/bjr.75.893.750417
47. Huette P, Guinot PG, Haye G, et al. Portal Vein Pulsatility as a Dynamic Marker of Venous Congestion Following Cardiac Surgery: An Interventional Study Using Positive End-Expiratory Pressure. J Clin Med. 2021;10(24). doi:10.3390/jcm10245810
48. Hermansen JL, Nørskov J, Juhl-Olsen P. Effects of changes in position, positive end-expiratory pressure and mean arterial pressure on renal, portal and hepatic Doppler ultrasound perfusion indices: a randomized crossover study in cardiac surgery patients. J Clin Monit Comput. 2022;36(6):1841-1850. doi:10.1007/s10877-022-00834-0
49. Iida N, Seo Y, Sai S, et al. Clinical Implications of Intrarenal Hemodynamic Evaluation by Doppler Ultrasonography in Heart Failure. JACC Heart Fail. 2016;4(8):674-82. doi:10.1016/j.jchf.2016.03.016
50. Husain-Syed F, Birk HW, Ronco C, et al. Doppler-Derived Renal Venous Stasis Index in the Prognosis of Right Heart Failure. J Am Heart Assoc. 2019;8(21):e013584. doi:10.1161/JAHA.119.013584
51. Fujii K, Nakayama I, Izawa J, et al. Association between intrarenal venous flow from Doppler ultrasonography and acute kidney injury in patients with sepsis in critical care: a prospective, exploratory observational study. Crit Care. 2023;27(1):278. doi:10.1186/s13054-023-04557-9
52. Spiegel R, Teeter W, Sullivan S, et al. The use of venous Doppler to predict adverse kidney events in a general ICU cohort. Crit Care. 2020;24(1):615. doi:10.1186/s13054-020-03330-6
53. Zhai SS, Shang L, Ren DZ, Chen YY, Wang H. Portable handheld ultrasound for VExUS assessment in critical care: Reliability and time efficiency in resident-led examinations. J Crit Care. 2025;91:155224. doi:10.1016/j.jcrc.2025.155224
54. Longino AA, Martin KC, Leyba KR, et al. Reliability and reproducibility of the venous excess ultrasound (VExUS) score, a multi-site prospective study: validating a novel ultrasound technique for comprehensive assessment of venous congestion. Crit Care. 2024;28(1):197. doi:10.1186/s13054-024-04961-9
55. de Oliveira-Gomes D, Drazner RM, Dimza M, et al. Novel 4-Stage Classification to Estimate Right Atrial Pressure by Point-of-Care Ultrasound of Neck Vasculature. JACC Heart Fail. 2026;14(2):102707. doi:10.1016/j.jchf.2025.102707
56. Bhardwaj V, Samprathi A, Saha K, et al. Dual doppler dynamics: integrating femoral venous doppler and VExUS for predicting organ dysfunction in acute heart failure. J Anesth Analg Crit Care. 2025;5(1):65. doi:10.1186/s44158-025-00283-6
57. Giangregorio F, Centenara E, Mazzocchi S, et al. Assessing Venous Congestion in Acute and Chronic Heart Failure: A Review of Splanchnic, Cardiac and Pulmonary Ultrasound: Part 1: Conventional B-Mode, Colordoppler, and Vexus Protocol. J Clin Med. 2025;14(22). doi:10.3390/jcm14228147
58. Gonzalez C, Chamberland ME, Aldred MP, et al. Constrictive pericarditis: portal, splenic, and femoral venous Doppler pulsatility: a case series. Can J Anaesth. 2022;69(1):119-128. doi:10.1007/s12630-021-02126-8
59. Mullens W, Abrahams Z, Francis GS, et al. Importance of venous congestion for worsening of renal function in advanced decompensated heart failure. J Am Coll Cardiol. 2009;53(7):589-596. doi:10.1016/j.jacc.2008.05.068
60. Damman K, van Deursen VM, Navis G, Voors AA, van Veldhuisen DJ, Hillege HL. Increased central venous pressure is associated with impaired renal function and mortality in a broad spectrum of patients with cardiovascular disease. J Am Coll Cardiol. 2009;53(7):582-588. doi:10.1016/j.jacc.2008.08.080
61. Legrand M, Dupuis C, Simon C, et al. Association between systemic hemodynamics and septic acute kidney injury in critically ill patients: a retrospective observational study. Crit Care. 2013;17(6):R278. doi:10.1186/cc13133
62. Chen KP, Cavender S, Lee J, et al. Peripheral Edema, Central Venous Pressure, and Risk of AKI in Critical Illness. Clin J Am Soc Nephrol. 2016;11(4):602-8. doi:10.2215/CJN.08080715
63. Husain-Syed F, Gröne HJ, Assmus B, et al. Congestive nephropathy: a neglected entity? Proposal for diagnostic criteria and future perspectives. ESC Heart Fail. 2021;8(1):183-203. doi:10.1002/ehf2.13118
64. Styczynski G, Milewska A, Marczewska M, et al. Echocardiographic Correlates of Abnormal Liver Tests in Patients with Exacerbation of Chronic Heart Failure. J Am Soc Echocardiogr. 2016;29(2):132-9. doi:10.1016/j.echo.2015.09.012
65. Eke C, Szabó A, Nagy Á, et al. Association between Hepatic Venous Congestion and Adverse Outcomes after Cardiac Surgery. Diagnostics (Basel). 2022;12(12). doi:10.3390/diagnostics12123175
66. Valentova M, von Haehling S, Bauditz J, et al. Intestinal congestion and right ventricular dysfunction: a link with appetite loss, inflammation, and cachexia in chronic heart failure. Eur Heart J. 2016;37(21):1684-91. doi:10.1093/eurheartj/ehw008
67. Benkreira A, Beaubien-Souligny W, Mailhot T, et al. Portal Hypertension Is Associated With Congestive Encephalopathy and Delirium After Cardiac Surgery. Can J Cardiol. 2019;35(9):1134-1141. doi:10.1016/j.cjca.2019.04.006
68. Verbrugge FH, Dupont M, Steels P, et al. Abdominal contributions to cardiorenal dysfunction in congestive heart failure. J Am Coll Cardiol. 2013;62(6):485-95. doi:10.1016/j.jacc.2013.04.070
69. Mullens W, Abrahams Z, Francis GS, Taylor DO, Starling RC, Tang WH. Prompt reduction in intra-abdominal pressure following large-volume mechanical fluid removal improves renal insufficiency in refractory decompensated heart failure. J Card Fail. 2008;14(6):508-14. doi:10.1016/j.cardfail.2008.02.010
70. Longino A, Martin K, Leyba K, et al. Correlation between the VExUS score and right atrial pressure: a pilot prospective observational study. Crit Care. 2023;27(1):205. doi:10.1186/s13054-023-04471-0
71. Martin KC, Gill EA, Douglas IJ, Longino AA. Evaluation of a modified venous excess ultrasound (VExUS) protocol for estimation of venous congestion: a cohort study. Ultrasound J. 2025;17(1):7. doi:10.1186/s13089-025-00411-x
72. Andrei S, Bahr PA, Nguyen M, Bouhemad B, Guinot PG. Prevalence of systemic venous congestion assessed by Venous Excess Ultrasound Grading System (VExUS) and association with acute kidney injury in a general ICU cohort: a prospective multicentric study. Crit Care. 2023;27(1):224. doi:10.1186/s13054-023-04524-4
73. Klompmaker P, Mousa A, Allard DJ, et al. The association between venous excess ultrasound grading system (VExUS) and major adverse kidney events after 30 days in critically ill patients: A prospective cohort study. J Crit Care. 2025;88:155097. doi:10.1016/j.jcrc.2025.155097
74. Beaubien-Souligny W, Galarza L, Buchannan B, et al. Prospective Study of Ultrasound Markers of Organ Congestion in Critically Ill Patients With Acute Kidney Injury. Kidney Int Rep. 2024;9(3):694-702. doi:10.1016/j.ekir.2023.12.018
75. Melo RH, Gioli-Pereira L, Melo E, Rola P. Venous excess ultrasound score association with acute kidney injury in critically ill patients: a systematic review and meta-analysis of observational studies. Ultrasound J. 2025;17(1):16. doi:10.1186/s13089-025-00413-9
76. Borroni VN, Antonini A, Cogliati CB, Casella F. A comprehensive review of venous excess ultrasound (VExUS) score: evidence from original research. Intern Emerg Med. 2026;21(2):373-384. doi:10.1007/s11739-025-04220-x
77. Islas-Rodríguez JP, Miranda-Aquino T, Romero-González G, et al. Effect on Kidney Function Recovery Guiding Decongestion with VExUS in Patients with Cardiorenal Syndrome 1: A Randomized Control Trial. Cardiorenal Med. 2024;14(1):1-11. doi:10.1159/000535641
78. Jobs A, Rausch TK, König IR, et al. Inferior Vena Cava Ultrasound to Guide Decongestion in Acute Decompensated Heart Failure: A Randomized Controlled Trial. JACC Heart Fail. 2025;13(10):102578. doi:10.1016/j.jchf.2025.102578
79. Abu-Naeima E, Fatthy M, Shalaby MAA, et al. Venous Excess Doppler ultrasound assessment and loop diuretic efficiency in acute cardiorenal syndrome. BMC Nephrol. 2025;26(1):157. doi:10.1186/s12882-025-04060-z
80. Evezard C, Bahr PA, Nguyen M, Bouhemad B, Guinot PG. Association between VExUS score and worsening renal function during diuretic therapy in the ICU. Intensive Care Med Exp. 2026;14(1). doi:10.1186/s40635-026-00890-9
81. Payen D, de Pont AC, Sakr Y, Spies C, Reinhart K, Vincent JL. A positive fluid balance is associated with a worse outcome in patients with acute renal failure. Crit Care. 2008;12(3):R74. doi:10.1186/cc6916
82. Silversides JA, Major E, Ferguson AJ, et al. Conservative fluid management or deresuscitation for patients with sepsis or acute respiratory distress syndrome following the resuscitation phase of critical illness: a systematic review and meta-analysis. Intensive Care Med. 2016;43(2):155-170. doi:10.1007/s00134-016-4573-3
83. Yogeswaran A, Kremer NC, Janetzko P, et al. Right-sided heart failure in acute respiratory distress syndrome. Eur Respir Rev. 2025;34(177). doi:10.1183/16000617.0060-2025
84. Korabathina R, Heffernan KS, Paruchuri V, et al. The pulmonary artery pulsatility index identifies severe right ventricular dysfunction in acute inferior myocardial infarction. Catheter Cardiovasc Interv. 2012;80(4):593-600. doi:10.1002/ccd.23309
85. Beigel R, Cercek B, Luo H, Siegel RJ. Noninvasive evaluation of right atrial pressure. J Am Soc Echocardiogr. 2013;26(9):1033-42. doi:10.1016/j.echo.2013.06.004
86. Prescott HC, Antonelli M, Alhazzani W, et al. Surviving Sepsis Campaign: International Guidelines for Management of Sepsis and Septic Shock 2026. Crit Care Med. 2026;54(4):725-812. doi:10.1097/CCM.0000000000007075
87. Levitov A, Frankel HL, Blaivas M, et al. Guidelines for the Appropriate Use of Bedside General and Cardiac Ultrasonography in the Evaluation of Critically Ill Patients-Part II: Cardiac Ultrasonography. Crit Care Med. 2016;44(6):1206-27. doi:10.1097/CCM.0000000000001847
88. Qian X, Zhen J, Meng Q, Li L, Yan J. Intrarenal Doppler approaches in hemodynamics: A major application in critical care. Front Physiol. 2022;13:951307. doi:10.3389/fphys.2022.951307
89. Bahner DP, Hughes D, Royall NA. I-AIM: a novel model for teaching and performing focused sonography. J Ultrasound Med. 2012;31(2):295-300. doi:10.7863/jum.2012.31.2.295
Чеклист біля ліжка хворого
 Скануйте, щоб відкрити чеклист на телефоні